


British Pound Likely to Extend Declines – The Big Picture
Currencies / British Pound Jul 27, 2018 - 10:44 AM GMTBy: Submissions

 FXOpen writes: The weekly chart of GBP/USD indicates that pair broke key support levels. On the other hand, EUR/GBP may perhaps move higher in the medium term.
Key Points
- The British Pound started a major downward move from the 1.4375 swing high against the US Dollar.
- GBP/USD broke a key bullish trend line with support at 1.3720 on the weekly chart.
- EUR/GBP formed a short-term top near the 0.9300 level and declined.
- The pair is following a declining channel with resistance near 0.8930 on the weekly chart.
GBP/USD Technical Analysis
The British started a major upward move from the 1.2000 swing low in February 2017 against the US Dollar. The GBP/USD pair traded above the 1.3000 and 1.4000 handles in 2018.
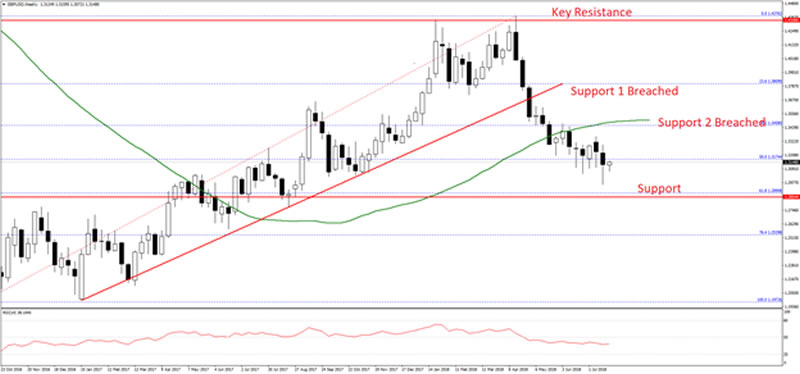
However, the 1.4375-1.4400 area acted as a strong resistance, resulting in a downward move. The pair started a strong decline and moved below the 1.4000 and 1.3500 support levels. Moreover, there was a break below the 38.2% Fib retracement level of the last wave from the 1.1972 low to 1.4376 high.
More importantly, there was a break below a key bullish trend line with support at 1.3720 on the weekly chart. The pair also closed below the 50-week simple moving average to move into a bearish zone.
The next support on the downside is near 1.2900 and the 61.8% Fib retracement level of the last wave from the 1.1972 low to 1.4376 high. Should there be a break below the 1.2900 support, the pair may perhaps accelerate declines towards the 1.2800 and 1.2600 levels.
On the other hand, if GBP/USD corrects higher, it is likely to face resistance near the 1.3400 and 1.3500 levels, which are close to the 21-week SMA. The overall bias is slightly bearish on the weekly timeframe, and only a close back above 1.3500 could push the pair back in a bullish zone.
EUR/GBP Technical Analysis
The Euro gained traction during the last 2017 and moved above the 0.8800 and 0.8900 resistance levels against the British Pound. The EUR/GBP pair traded close to the 0.9300 level where sellers appeared.
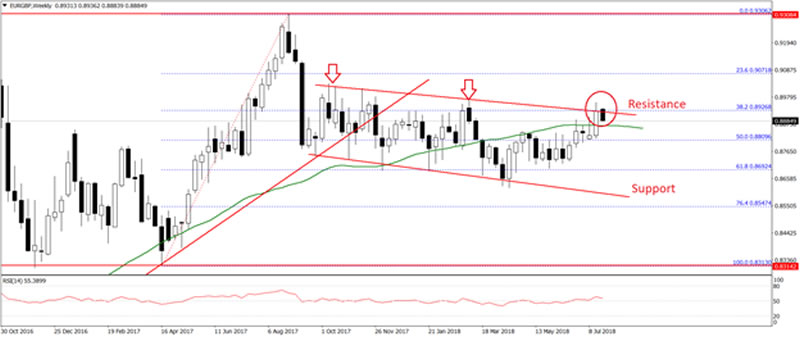
The pair started a downside move and declined below the 0.9000 and 0.8900 support levels. There was also a break below the 50% Fib retracement level of the last wave from the 0.8313 low to 0.9306 high.
However, the 0.8650 support area acted as a strong barrier for buyers. Moreover, the 61.8% Fib retracement level of the last wave from the 0.8313 low to 0.9306 high also acted as a support.
The pair is currently recovering and is following a declining channel with resistance near 0.8930 on the weekly chart. More importantly, the pair is trading above the 0.8800 pivot level and the 21-week simple moving average.
Should the pair succeed in clearing the channel resistance near 0.8930 and 0.8950, there could be more gains in EUR/GBP in the near term. Above 0.8950, the pair may perhaps move above the 0.9000 resistance.
On the flip side, if the pair fails to settle above the channel resistance at 0.8930, there may possibly be a downward reaction back toward the 0.8800 support. Below this, the pair is likely to test the channel support near the 0.8600 handle in the medium term.
Overall, the British Pound is under pressure and it could decline further versus the US Dollar and Euro in the medium term.
The market outlook is provided by FXOpen broker.
FXOpen - true ECN/STP Forex and cryptocurrency broker.
© 2018 Copyright FXOpen - All Rights Reserved Disclaimer: The above is a matter of opinion provided for general information purposes only and is not intended as investment advice. Information and analysis above are derived from sources and utilising methods believed to be reliable, but we cannot accept responsibility for any losses you may incur as a result of this analysis. Individuals should consult with their personal financial advisors.
© 2005-2022 http://www.MarketOracle.co.uk - The Market Oracle is a FREE Daily Financial Markets Analysis & Forecasting online publication.