


British Pound, Canadian Dollar, Russian Ruble and Euro Show Massive Volatility / Rotation Setup
Currencies / Forex Trading Jul 26, 2018 - 01:10 PM GMTBy: Chris_Vermeulen

 Our research team has been watching the foreign currency markets with great interest. Recently, the strength of the US Dollar has put extended pressures on many foreign currencies. The recent crash of the Chinese Yuan has alerted many traders to the concerns that China could be edging over the precipice in terms of debt and credit market collapse.
As traders/investors, we need to understand how these currencies move, and future moves may drive the global equity markets to new highs or lows. Let’s take a brief look at how some of our proprietary indicators are set up on these Weekly charts.
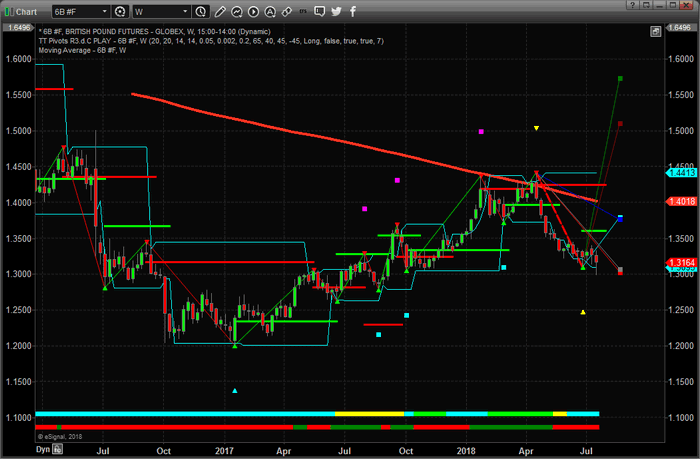
Weekly British Pound chart
This Weekly British Pound chart showing our proprietary Fibonacci Price Modeling system presents a very clear picture that the current trend is Bearish and that price is contracting. The Weekly Fibonacci price modeling system functions as an adaptive price modeling system – allowing the price rotations (peaks and valleys – highlighted by the yellow, cyan, magenta and white markers on the chart) to develop into a concise and efficient current model of price expectations and projections. The multiple price projection levels (the six projected lines to the right of the current price bar) show us where price may attempt to target should a breakout move happen.
Notice that the current British Pound price has reached and stalled near the 1.3100 level – which is exactly where two of our Fibonacci price modeling system has predicted with the Red and Grey projection levels? Also, notice how the Blue and Cyan projected levels are aligning near 1.3775? This would be a proper expected price level should price find some support near the 1.3000 level and attempt a short recovery.
As get further into these charts, please understand the key elements of these charts and what they are attempting to illustrate to all of us. With each pivot high or low, this price modeling system identifies a “trigger price level” that is used to confirm a trend reversal (if it happens) as well as to identify key future support/resistance. These are drawn as Green and Red horizontal lines. You’ll notice a Green trigger price level near the current price bar – this is the “upside price trigger level” that would have to be breached if we were to see any further upside price advance. As long as price stays below this level, we should continue to expect a downside price move with a strong potential for new lows.
Summarizing this charts analysis, the current trend is Bearish. The current bullish trigger level is near 1.3600. Price is trending lower from a previous Bearish price trigger level near 1.4240. Price has reached the two (Red & Grey) projected price levels which means we should expect some price consolidation near these levels before establishing a new price trend (extending lower or rotating higher). Recent, new price bar lows show a very strong potential for further downside price activity. At this point, we see that support from a previous bottom, near 1.3060, will likely cause the price to stall near this level. We believe the price will continue to fall below the 1.3000 eventually as the strength of the US Dollar continues to push higher and the Brexit issues continue. The British Pound could fall well below 1.2500 before finding real support. Wait for this consolidation period to end and watch for lower prices to continue.
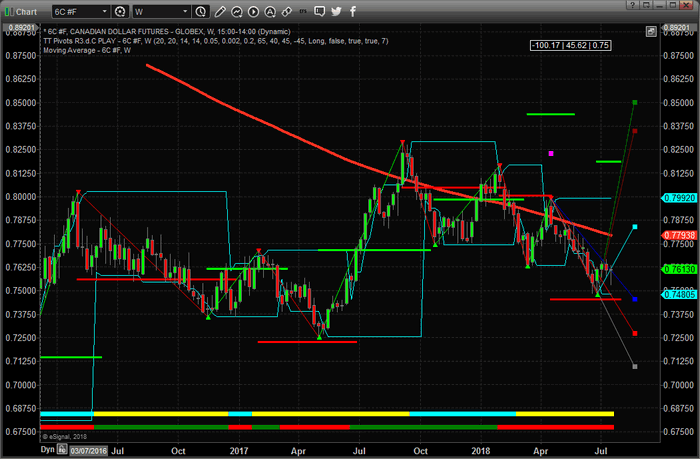
Weekly Canadian Dollar chart
This Weekly Canadian Dollar chart below shows a very interesting setup with our proprietary price modeling system. Notice the wide range between the trigger price levels (Green and Red) near the right edge of this chart? This extended range of the trigger price levels happens when the adaptive price modeling system finds price trend rotation. Previously, on this chart, we can see the trigger price levels were closer to price and within rotational ranges – the most recent breached trigger level being a Red (Bearish) trigger – indicating the start of a new bearish trend near February 5, 2018.
At this point, should price fall below 0.7450, we should expect price to continue to drop towards 0.7250. Upside resistance should be near the Cyan projected price level – near 0.7850. Unless the Canadian Dollar finds support near 0.7500 and rotates higher to breach 0.81875 – this is nothing but extended price rotation. Typically, as price sets up an extended Top or Bottom, the trigger price levels will eventually tighten to establish a breakout trend setup. Right now, the extended ranges of these trigger levels is showing us that volatility and price rotation should be expected and the downward sloping Moving Average level will likely operate as a key resistance zone. The YELLOW markers at the bottom of the chart show us that price range is expanding and volatility is increasing. We could see some bigger swings in the Canadian Dollar over the next few weeks and months – but the trend is still bearish.
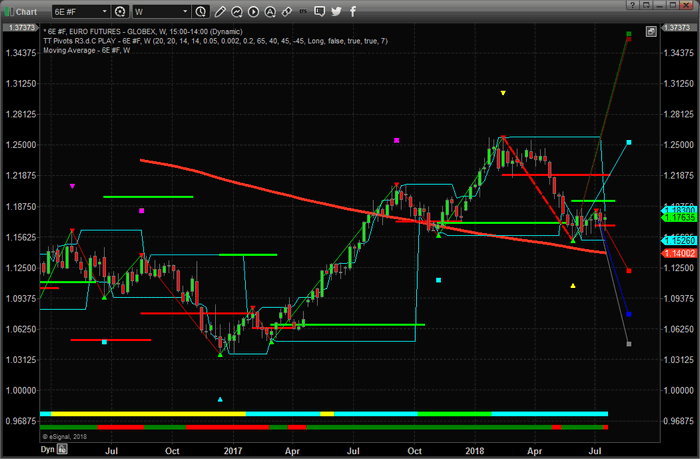
Weekly Euro chart
This Weekly Euro chart shows a more traditional price rotation setup with our Fibonacci price modeling system. Notice how the trigger price levels are very narrow and close to the current price. You’ll also notice the Cyan price trend indicator, near the bottom of the chart, that is indicating that price range is contracting. The two price trigger levels (Red and Green) provide very clear breakout trigger levels (bullish near 1.1913 & bearish near 1.1687). The most recent trigger level to be breached was the Bearish level near 1.2200. A recent low price rotation has established a new low price pivot that is projecting much higher price projection points. Additionally, a more recent high price rotation has established new lower price projection points.
This sideways price rotation will be broken and a new trend will be established in time. At this point, we know the 1.1913 level is the bullish trend trigger point and the 1.1687 level is the bearish trend trigger point. Price trend is still bearish and any lower price breakdown below 1.1576 would be a strong indication that price is breaking below current support and should attempt to move to near 1.1000. To summarize, the Euro appears to be under extended pressure and any price breakdown could be a great short for traders.
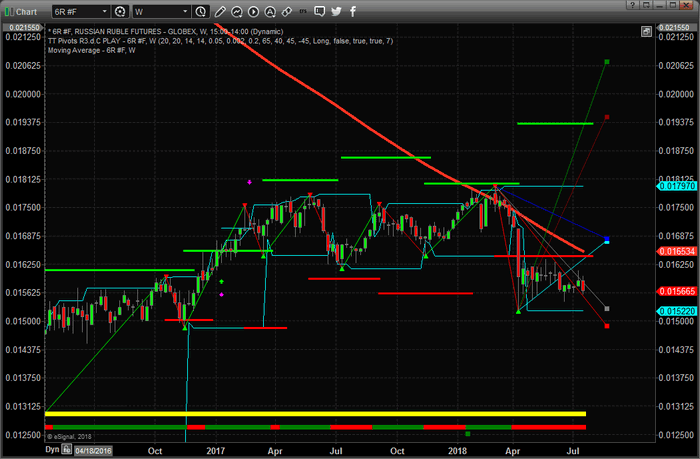
Russian Ruble Weekly chart
Lastly, this Russian Ruble Weekly chart shows, again, price rotation and volatility. Notice how the bullish trigger price levels have been expanding throughout this sideways price rotation for the past year or longer?
As we stated early, the adapting modeling component of our proprietary Fibonacci price modeling system identified this rotation as “extended price congestion” and attempts to identify broader market breakout levels as a means to confirm a true change in price trend. The most recent bearish trigger price level was breached on April 9, 2018. Price is trending lower/bearish and the price trend indicator near the bottom is showing yellow – price volatility is expanding. We should expect further downside price moves with expanded volatility. Any price move below 0.01520 will indicate a very strong downside price move with the potential for price to reach 0.01250.
Concluding Thoughts:
Overall, we need to remember the recent political, economic and geopolitical conundrums are reflecting in expectations within global economies and currencies to be put under greater concerns. What was once a given, that the world would continue to operate without much disruption in the global balance of thing, is now open for debate. We are watching global concerns and liabilities as a result of China’s recent downturn and currency devaluation reflect in additional concerns throughout the global currency markets. We have to be aware that these issues typically don’t end quickly or without some form of government intervention. This means we may have quite a bit of time to play these moves and find good trades.
Right now, the Russian Ruble, British Pound and the Canadian Dollar appear to be poised for a breakdown in prices in the immediate future – breaking through support and possibly dropping to recent historical lows. The Euro is setting up for a breakout/breakdown move with a very narrow trigger price level range. The Euro may follow rally, briefly, if the US Dollar retraces a bit from current levels. Remember, these are weekly chart and help to understand the broader price trend. A breakdown in the Russian Ruble, British Pound and Canadian Dollar would likely coincide with a rally in the US Dollar and possibly the Euro. Therefore, watch for weakness in these markets and strength in the US Dollar as these moves happen.
If you’ve been follow our research recently, you already know why our members and followers stay dedicated to our team and our services. We have called nearly every move in the markets over the past 8 months perfectly. We urge you to visit www.TheTechnicalTraders.com to read some of our most recent research and to stay ahead of the markets by joining our membership services where we provide access to our most advanced predictive analysis tools and research. You owe it to yourself to have a dedicated team of professionals that can help you find success and stay ahead of the markets if you want to build greater success in your future.
53 years experience in researching and trading makes analyzing the complex and ever-changing financial markets a natural process. We have a simple and highly effective way to provide our customers with the most convenient, accurate, and timely market forecasts available today. Our stock and ETF trading alerts are readily available through our exclusive membership service via email and SMS text. Our newsletter, Technical Trading Mastery book, and 3 Hour Trading Video Course are designed for both traders and investors. Also, some of our strategies have been fully automated for the ultimate trading experience.
Get our advanced research and market reporting, Daily market videos, detailed trading signals and join the hundreds of other traders that follow our research every day and profit.
Chris Vermeulen
www.TheTechnicalTraders.com
Chris Vermeulen has been involved in the markets since 1997 and is the founder of Technical Traders Ltd. He is an internationally recognized technical analyst, trader, and is the author of the book: 7 Steps to Win With Logic
Through years of research, trading and helping individual traders around the world. He learned that many traders have great trading ideas, but they lack one thing, they struggle to execute trades in a systematic way for consistent results. Chris helps educate traders with a three-hour video course that can change your trading results for the better.
His mission is to help his clients boost their trading performance while reducing market exposure and portfolio volatility.
He is a regular speaker on HoweStreet.com, and the FinancialSurvivorNetwork radio shows. Chris was also featured on the cover of AmalgaTrader Magazine, and contributes articles to several leading financial hubs like MarketOracle.co.uk
Disclaimer: Nothing in this report should be construed as a solicitation to buy or sell any securities mentioned. Technical Traders Ltd., its owners and the author of this report are not registered broker-dealers or financial advisors. Before investing in any securities, you should consult with your financial advisor and a registered broker-dealer. Never make an investment based solely on what you read in an online or printed report, including this report, especially if the investment involves a small, thinly-traded company that isn’t well known. Technical Traders Ltd. and the author of this report has been paid by Cardiff Energy Corp. In addition, the author owns shares of Cardiff Energy Corp. and would also benefit from volume and price appreciation of its stock. The information provided here within should not be construed as a financial analysis but rather as an advertisement. The author’s views and opinions regarding the companies featured in reports are his own views and are based on information that he has researched independently and has received, which the author assumes to be reliable. Technical Traders Ltd. and the author of this report do not guarantee the accuracy, completeness, or usefulness of any content of this report, nor its fitness for any particular purpose. Lastly, the author does not guarantee that any of the companies mentioned in the reports will perform as expected, and any comparisons made to other companies may not be valid or come into effect.
Chris Vermeulen Archive |
© 2005-2022 http://www.MarketOracle.co.uk - The Market Oracle is a FREE Daily Financial Markets Analysis & Forecasting online publication.