Berkshire Hathaway Stock Aiming for Recovery
Companies / Company Chart Analysis Jul 13, 2018 - 07:54 PM GMTBerkshire Hathaway (Class A NYSE: BRK.A – Class B NYSE: BRK.B) is currently the seventh largest company in the S&P 500 Index by market capitalization. The company ,lead by Warren Buffett, has averaged an annual growth in book value of 19.0% to its shareholders since 1965.
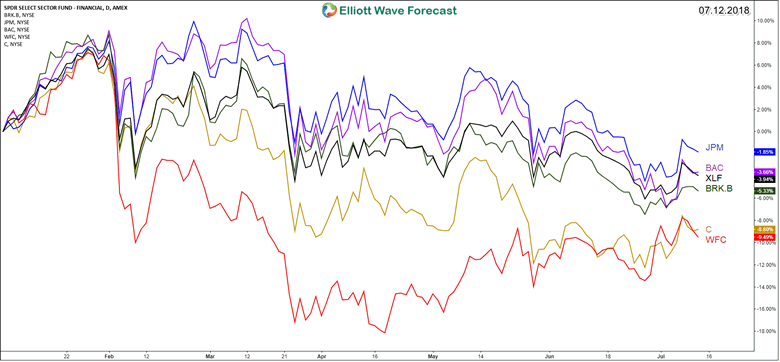
Berkshire Hathaway Class B NYSE: BRK.B is one of the main stock within the Financial Select Sector SPDR Fund XLF. Year-to-date, the whole financial sector is still pointing in the negative side and not seeing any profit yet.
The 5 most weighted stocks in XLF are Berkshire, JP Morgan, Bank of America, Wells Fargo and Citibank . They will be reporting earning tomorrow and next week which may shift things around in the coming few weeks to end up with a green summer.

The stock market is turning bullish as Technology & Consumer Discretionary sectors already leading the move higher, so we need to take a look at the technical Elliott Wave structure of BRK.B to help identify the path for the Financial sector.
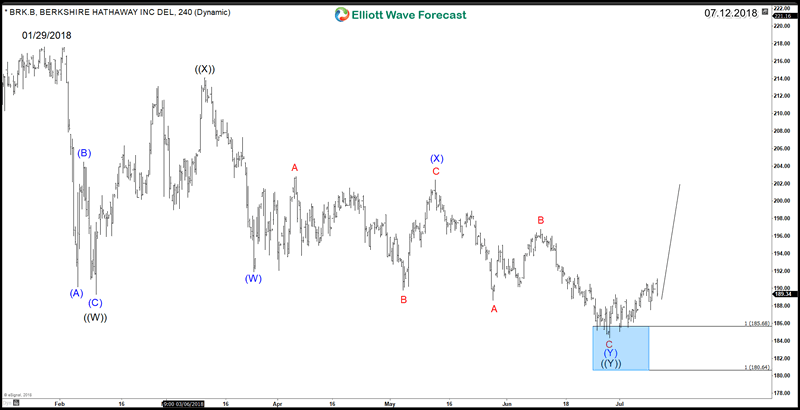
Since 01/29/2018 peak, Berkshire Hathaway did a corrective 7 swings structure ( Double Three ) which reached it’s equal legs area around $185.68 – $180.64. Up from there the stock started bouncing higher and it’s expected to resume the rally to new all time highs with a minimum target at $225 – $238 area.
Berkshire Hathaway BRK.B 4H Chart 07.12.2018

Recap:
Berkshire Hathaway is looking for at least a 50% bounce to correct the decline from January peak which may be followed later on by a higher move to take that peak and open a new daily cycle to the upside.
If you are interested to see Elliott Wave analysis on Soybean or other commodities, forex, and Indices, you are welcome to take 14 days FREE Trial, You can check our service and get Elliott Wave chart updates in 4 time frames, live session, and signal service (live trading room).
By Ayoub Ben Rejeb
https://elliottwave-forecast.com
ElliottWave-Forecast has built its reputation on accurate technical analysis and a winning attitude. By successfully incorporating the Elliott Wave Theory with Market Correlation, Cycles, Proprietary Pivot System, we provide precise forecasts with up-to-date analysis for 78 instruments including Forex, Commodities, Indices and a number of Stocks & ETFs from around the World. Our clients also have immediate access to our proprietary Actionable Trade Setups, Market Overview, 1 Hour, 4 Hour, Daily & Weekly Wave Counts. Live Screen Sharing Sessions, Daily Technical Videos, Elliott Wave Setup and Weekend videos .
Copyright © 2018 ElliottWave-Forecast - All Rights Reserved Disclaimer: The above is a matter of opinion provided for general information purposes only and is not intended as investment advice. Information and analysis above are derived from sources and utilising methods believed to be reliable, but we cannot accept responsibility for any losses you may incur as a result of this analysis. Individuals should consult with their personal financial advisors.
© 2005-2022 http://www.MarketOracle.co.uk - The Market Oracle is a FREE Daily Financial Markets Analysis & Forecasting online publication.


