


The Euro, the British Pound and the Other Side of the Coin
Currencies / Forex Trading Jul 07, 2018 - 06:10 PM GMTBy: Nadia_Simmons

 Analyzing the medium-term charts of the euro and the British pound, we see that currency bulls fought fiercely with their rivals during recent weeks. Despite several attempts to push both currencies lower, they successfully defended their main strongholds in both cases and defeated fans of the greenback. What does this mean for the U.S. currency and its European competitors?
EUR/USD – Move that Rewards Determined Bulls
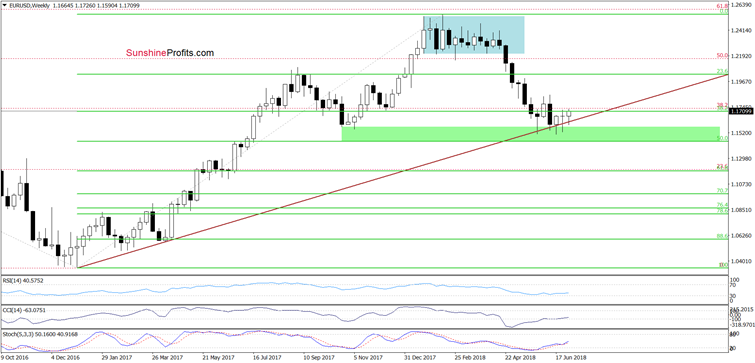
Looking at the weekly chart, we see that EUR/USD extended gains above the long-term brown rising support line and the buy signals generated by the medium-term indicators remain in the cards, suggesting a test of the June peak in the coming week.
Will the short-term chart confirm these pro-growth plans? Let’s check.
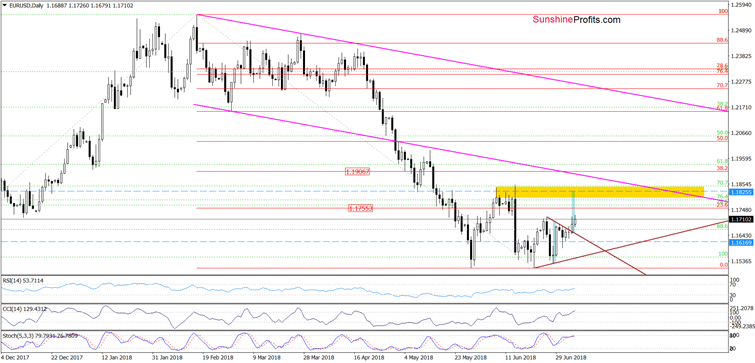
From today’s point of view, we see that although EUR/USD pulled back a bit yesterday, currency bulls didn’t give up and push the pair higher earlier today, making our long positions profitable.
In other words, yesterday’s breakout above the upper line of the brown triangle and its positive impact on the exchange rate are still in effect, supporting higher values of EUR/USD in the coming day(s).
How high could the pair go?
In our opinion, the breakout above the upper line of the triangle suggests further improvement and a test of the yellow resistance zone in the coming days.
Additionally, in this area, the size of the upward move will correspond to the height of the triangle, which increases the probability that market participants will reach (at least) the level of 1.1825.
GBP/USD – Third Time Lucky
In our last commentary on this currency pair, we wrote the following:
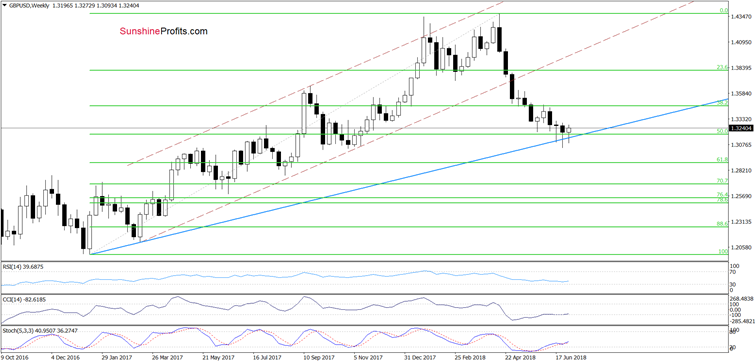
(…) GBP/USD rate rebounded quite sharply and invalidated the earlier breakdown under the long-term blue support line. Despite this bullish factor, currency bears managed to push the exchange rate lower, which resulted in a re-test of the above-mentioned blue line yesterday.
(…) this important support withstood the selling pressure, which triggered another move to the upside (…) GBP/USD climbed to the upper border of the blue consolidation (marked on the daily chart), which suggests that if we see a breakout above Friday’s peak, currency bulls can implement the pro-growth scenario (…)
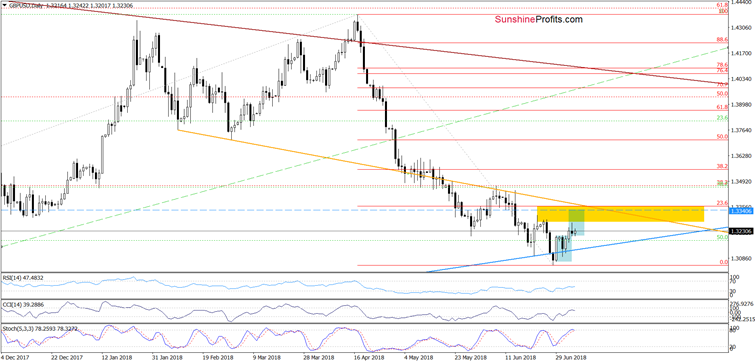
On the above charts, we see that the situation developed in tune with our assumptions and GBP/USD moved above the upper line of the blue consolidation. Although the pair erased some of Wednesday’s gains on the following day, yesterday’s price action looks like a verification of the earlier breakout.
Additionally, earlier today, the British pound increased against the greenback once again, which in combination with the medium-term picture suggests that higher values of GBP/USD are just around the corner – especially when we factor in the current situation in the USD Index about which you can read at the end of today's alert.
Nevertheless, before you do that, let's answer the most important question: how high can this currency pair go in the coming days?
Well, in our opinion, if the exchange rate extends gains from current levels, the initial upside target will be around 1.3340, where the size of the upward move will correspond to the height of the aforementioned consolidation.
USD/CAD – Something Pink, Something Blue
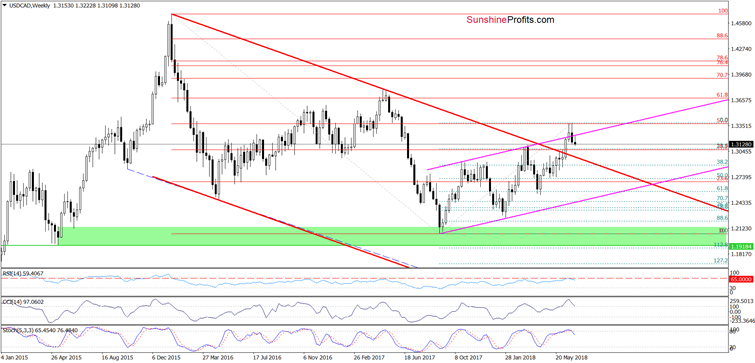
On the weekly chart, we see that an invalidation of the earlier breakout above the upper border of the pink rising trend channel and its negative impact on the exchange rate encouraged currency bears to act earlier this week, which made our short positions even more profitable.
Additionally, the RSI and the Stochastic Oscillator generated the sell signals for the first time since mid-March, increasing the probability of further deterioration in the coming weeks. At this point, it is worth noting, that back then similar sell signals preceded a sizable move to the downside, which increased the profits of our subscribers.
Will history repeat itself once again? Let’s look for more clues on the daily chart.
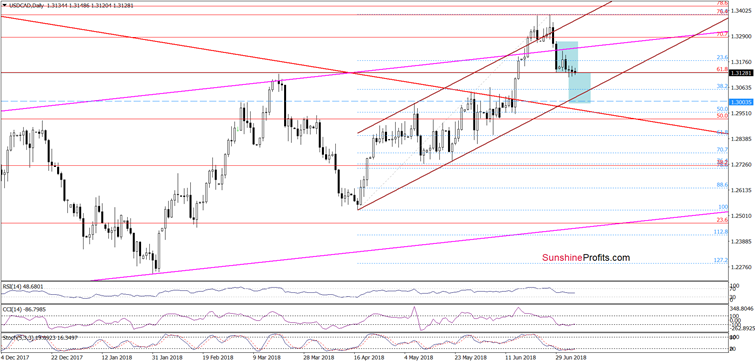
From this perspective, we see that USD/CAD slipped to the lower border of the blue consolidation and remains around it, but taking into account the broader perspective, we think that currency bears will likely try to reach (at least) the lower border of the brown rising trend channel (currently around 1.3018).
Nevertheless, if this support is broken, the way to the barrier of 1.3000 will be open (please note that in this area the size of the downward move will correspond to the height of the consolidation, which increases the likelihood of falling into this level if the bears show their strength and determination by breaking through the lower line of the aforementioned consolidation).
Finishing today’s Forex Trading Alert, let us introduce the icing on today's cake - the current situation in the USD Index and the most likely scenario for the next few days.
Focus on the Greenback
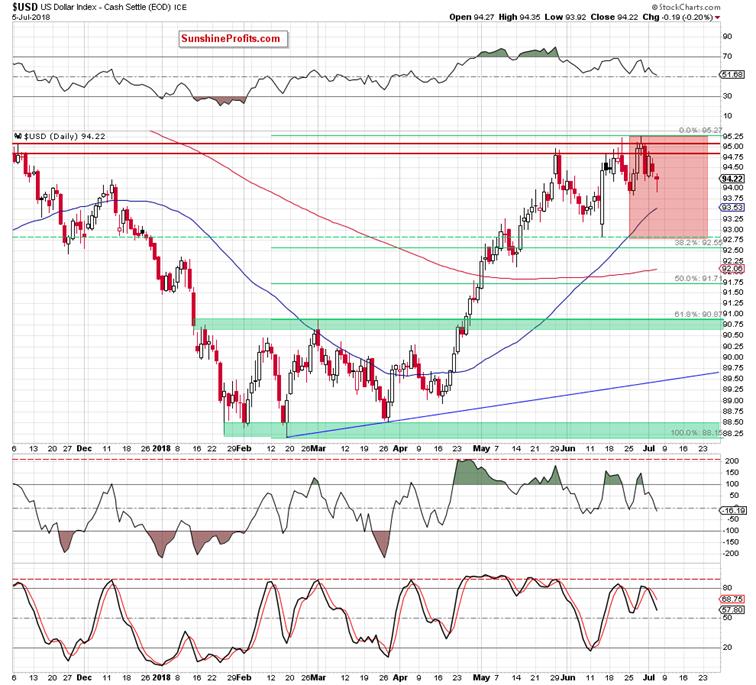
The first thing that catches the eye on the daily chart is an invalidation of the earlier breakout above two red resistance horizontal lines (they determine the red resistance zone marked on the medium-term chart below) and the previous peaks.
Such price action in combination with the sell signals generated by all daily indicators doesn’t bode well for the buyers and higher values of the greenback – especially when we factor in the broader perspective seen below.
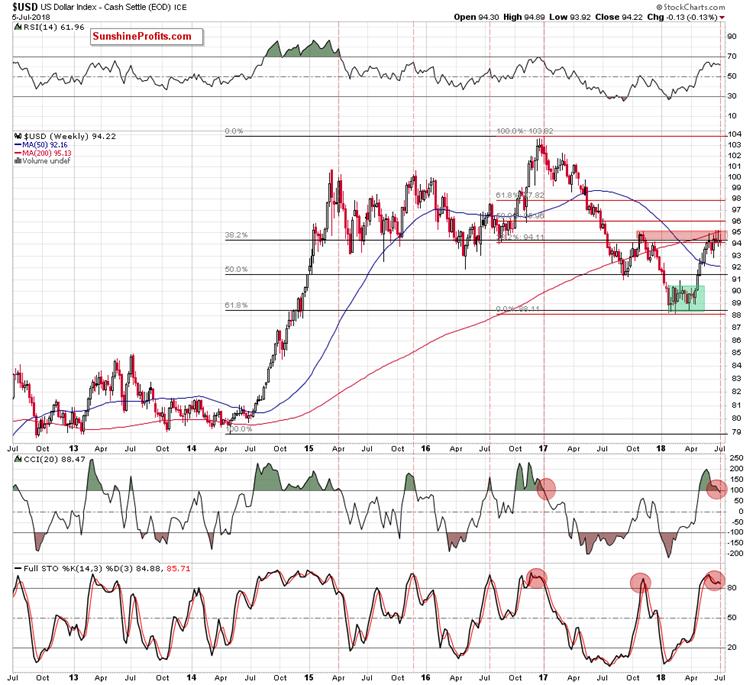
From the medium-term point of view, we see that the USD Index climbed to the red resistance zone created by the 38.2% Fibonacci retracement (based on the entire 2017-2018 declines), the October 2017 and November 2017 peaks and reinforced by the 200-week moving average.
In our opinion, this is a solid resistance area, which will likely stop the recent rally for a while and trigger a bigger correction in the coming week(s). This scenario is also reinforced by the fact that the CCI and the Stochastic Oscillator generated the sale signals in accordance – similarly to what we saw in the past.
What impact did such compatibility have on the greenback?
As you see on the weekly chart, we noticed a similar situation at the beginning of 2017. Back then, it preceded a significant move to the downside, which suggests that even if the index doesn’t drop very low (for example, to the level of 90), a correction in the coming week should not surprise us.
How low could the U.S. currency go?
In our opinion, if the greenback extends losses from current levels, the initial downside target will be around 92.82, where the bottom of the previous correction is (the mid-June low). If it is broken, the index, will likely test the strength of the 38.2% Fibonacci retracement around 92.55.
If you enjoyed the above analysis and would like to receive free follow-ups, we encourage you to sign up for our daily newsletter – it’s free and if you don’t like it, you can unsubscribe with just 2 clicks. If you sign up today, you’ll also get 7 days of free access to our premium daily Oil Trading Alerts as well as Gold & Silver Trading Alerts. Sign up now.
Nadia Simmons
Forex & Oil Trading Strategist
Przemyslaw Radomski
Founder, Editor-in-chief
Sunshine Profits: Gold & Silver, Forex, Bitcoin, Crude Oil & Stocks
Stay updated: sign up for our free mailing list today
* * * * *
Disclaimer
All essays, research and information found above represent analyses and opinions of Nadia Simmons and Sunshine Profits' associates only. As such, it may prove wrong and be a subject to change without notice. Opinions and analyses were based on data available to authors of respective essays at the time of writing. Although the information provided above is based on careful research and sources that are believed to be accurate, Nadia Simmons and his associates do not guarantee the accuracy or thoroughness of the data or information reported. The opinions published above are neither an offer nor a recommendation to purchase or sell any securities. Nadia Simmons is not a Registered Securities Advisor. By reading Nadia Simmons’ reports you fully agree that he will not be held responsible or liable for any decisions you make regarding any information provided in these reports. Investing, trading and speculation in any financial markets may involve high risk of loss. Nadia Simmons, Sunshine Profits' employees and affiliates as well as members of their families may have a short or long position in any securities, including those mentioned in any of the reports or essays, and may make additional purchases and/or sales of those securities without notice.
© 2005-2022 http://www.MarketOracle.co.uk - The Market Oracle is a FREE Daily Financial Markets Analysis & Forecasting online publication.