


The Stock Market’s “Turnover Bubble” Isn’t as Bad as it Sounds
Stock-Markets / Stock Markets 2018 Jul 06, 2018 - 01:11 PM GMTBy: Troy_Bombardia

 Every time you hear words “speculative behavior” used to describe a bull market in stocks, you should sit back and look at the data carefully.
- “Speculative behavior” is mostly code for “the market has gone up a lot, I’ve missed out on a lot of its gains, and this is a bubble but I don’t know when it will top”. In other words, calling something “speculative behavior” is not useful for making trading decisions. Calling something “a bubble” tells you NOTHING about when the market will top.
- Nominal data always looks like “speculative behavior” because inflation causes numbers to go up in the long term.
Some investors are concerned about the increase in the dollar value of shares traded in the S&P 500 (price of stocks * volume)
As the following chart demonstrates, the only times the dollar value of volume was this high ($3 trillion) was near the last 2 bull markets’ peaks. “This is a sign of speculative behavior” they say.
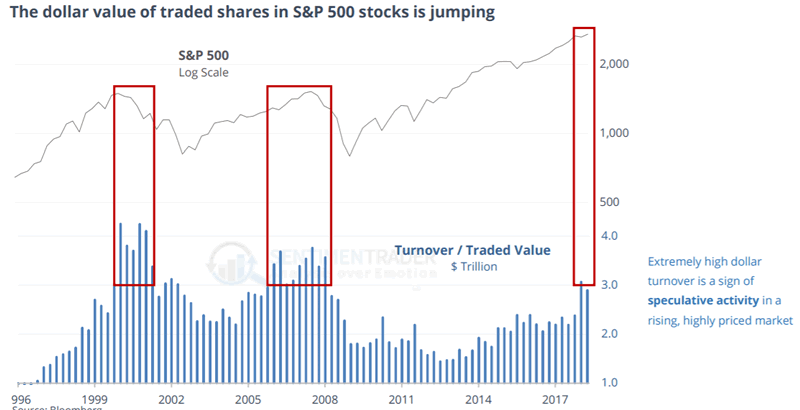
Except when you look closely at the data, you’ll come to 2 very different conclusions:
- When the dollar value of volume first became this high (in 1999 and 2006), the bull market in stocks still had 1 year left. You need MULTIPLE quarters of high volume before (i.e. A LOT of speculative behavior) before the bull market can top.
- This is a nominal value. It will forever trend higher in the long term because $3 trillion today is not the same thing as $3 trillion 18 years ago.
In fact, CPI is 48% higher today than it was in 1999. This means that $3 trillion today is actually equal $2 trillion in 1999 dollars (inflation-adjusted). Suddenly the “surge in speculation” seems a lot less speculative. Nominal values mean nothing. Real (inflation-adjusted) values are more important.
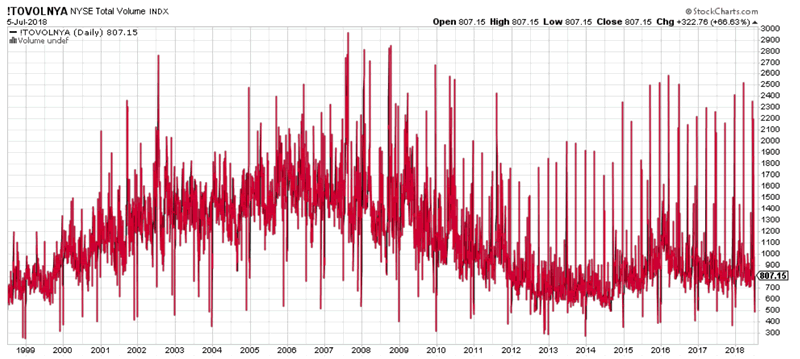
A better indicator for “speculative behavior” in the stock market is just VOLUME. This ignores the price of stocks. The dollar value of volume will forever trend higher in the long term simply because stock prices trend higher on a multi-decade time frame.
This chart demonstrates that the volume of shares traded on the NYSE has actually declined since 2007.
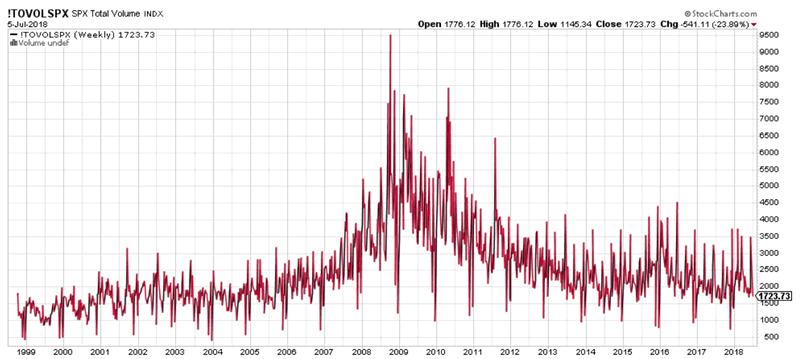
This chart demonstrates that the volume of shares traded for the S&P 500 has been flat since 2007
This chart demonstrates that the volume of shares traded on the NASDAQ has been flat since 2007.
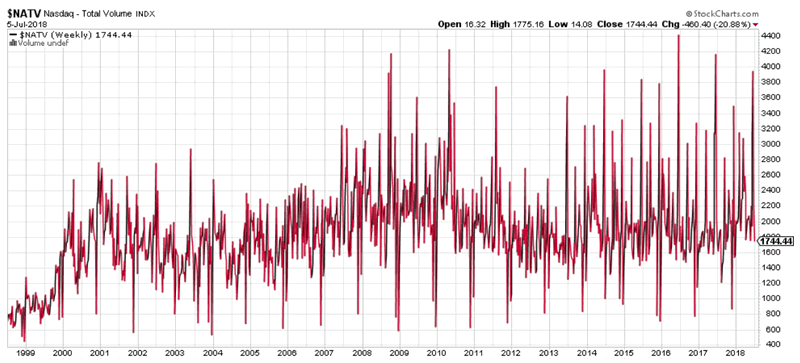
Volume is a better measure of speculative activity in the stock market than the dollar value of volume. The dollar value of volume is mostly just a function of the stock market’s price.
Right now, volume is not “surging”. This is not a sign of “speculative behavior” in the stock market.
Click here for more market studies
By Troy Bombardia
I’m Troy Bombardia, the author behind BullMarkets.co. I used to run a hedge fund, but closed it due to a major health scare. I am now enjoying life and simply investing/trading my own account. I focus on long term performance and ignore short term performance.
Copyright 2018 © Troy Bombardia - All Rights Reserved
Disclaimer: The above is a matter of opinion provided for general information purposes only and is not intended as investment advice. Information and analysis above are derived from sources and utilising methods believed to be reliable, but we cannot accept responsibility for any losses you may incur as a result of this analysis. Individuals should consult with their personal financial advisors.
© 2005-2022 http://www.MarketOracle.co.uk - The Market Oracle is a FREE Daily Financial Markets Analysis & Forecasting online publication.