


GBP/USD – Time to Jump in with Both Feet?
Currencies / British Pound Jul 04, 2018 - 02:49 PM GMTBy: Nadia_Simmons

 On Friday, the British pound showed strength against the greenback, which resulted in an invalidation of the breakdown under the long-term support line. The closure of the week above this important line emphasized the advantage of currency bulls over their rivals. What a pity that they rested on their laurels.Why? Because yesterday’s session erased most of the earlier rebound. This bucket of cold water, however, awakened the buyers who returned to the game for higher levels. What must they do to make GBP/USD grow above 1.3000?
EUR/USD vs. Short-term Triangle
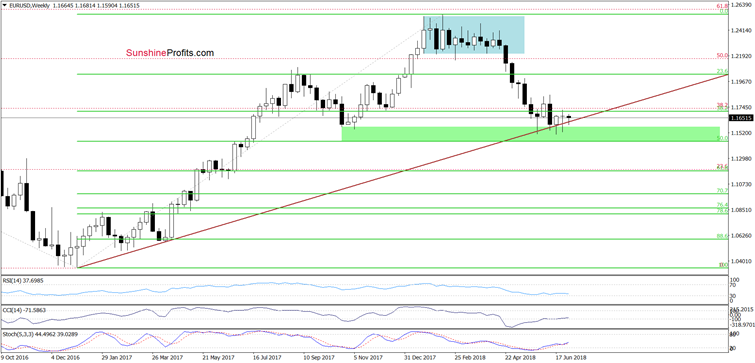
Yesterday, we wrote that EUR/USD reversed and declined a bit earlier today. Despite this move, the pair remains above the long-term brown rising line seen on the medium-term chart below.
Therefore, (…)as long as there is no weekly closure below it a sizable move to the downside is questionable. Why? Because we have seen four unsuccessful attempts to go below this important support line. (…) in all previous cases currency bulls were able to stop their opponents and trigger a rebound, which invalidated the breakdown. This means that they are very active in the green support area and as long as it holds another attempt to move higher can’t be ruled out.
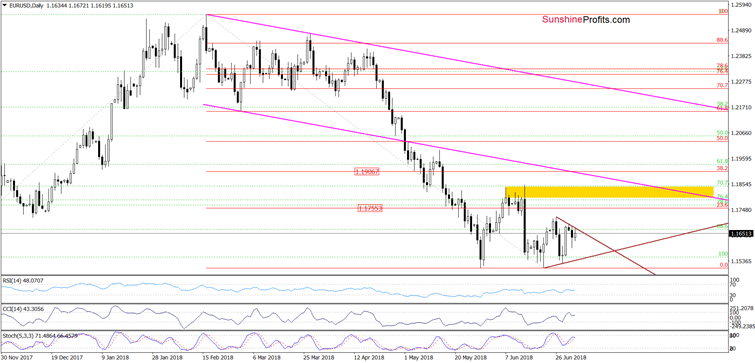
From today’s point of view, we see that the situation developed in tune with the above assumption and EUR/USD tuned north earlier today. Nevertheless, the exchange rate remains under the upper border of the brown triangle, which means that further improvement will be more likely only if we see a breakout above this resistance line.
What can happen if we see such price action? If currency bulls show strength, the pair will likely also break above the late June high and test 23.6% Fibonacci retracement or even the yellow resistance zone (created by the June peaks) in the following days.
However, symptoms of weakness in this area during today’s session can cost currency bulls quite a lot, because the exchange rate can get stuck inside the triangle even for the rest of the week.
So, what can we do? It seems that the most reasonable solution will be waiting without opening any positions. Nevertheless, if we see a breakout above the upper border of the formation (the brown triangle), we will consider opening a long position. As always, we will inform our subscribers about our decisions in the upcoming alerts. Stay in touch.
Will Consolidation Help GBP/USD go Higher?
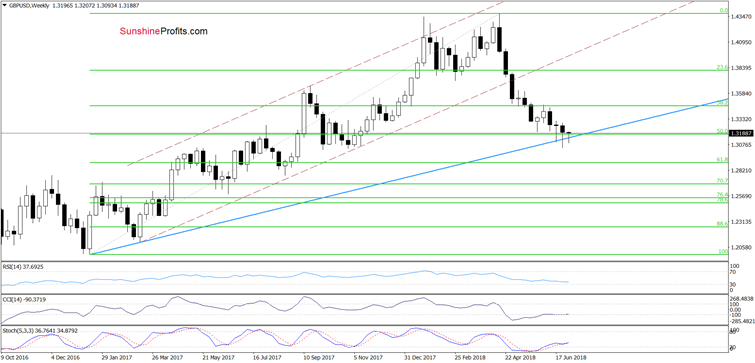
On Friday, GBP/USD rate rebounded quite sharply and invalidated the earlier breakdown under the long-term blue support line. Despite this bullish factor, currency bears managed to push the exchange rate lower, which resulted in a re-test of the above-mentioned blue line yesterday.
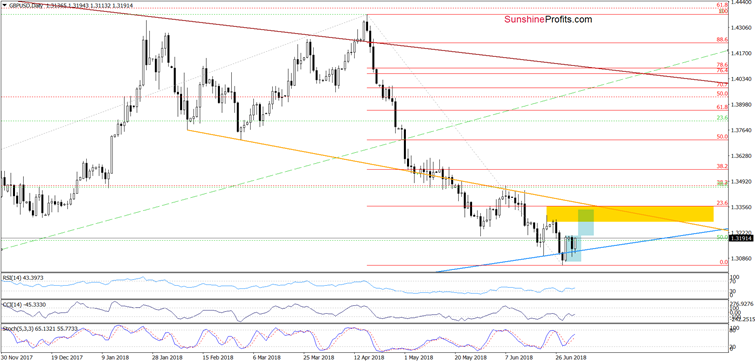
As you see on the charts, this important support withstood the selling pressure, which triggered another move to the upside. Thanks to today’s price action, GBP/USD climbed to the upper border of the blue consolidation (marked on the daily chart), which suggests that if we see a breakout above Friday’s peak, currency bulls can implement the pro-growth scenario. What do we mean by that?
Taking into account the fact that GBP/USD closed the previous week above the long-term blue support line, while the buy signals generated by the indicators remain in the cards, we think that if the exchange rate climbs above 1.3206, we’ll likely see further improvement and a test of the yellow resistance zone marked on the daily chart.
Implications of Breakdown in USD/CAD
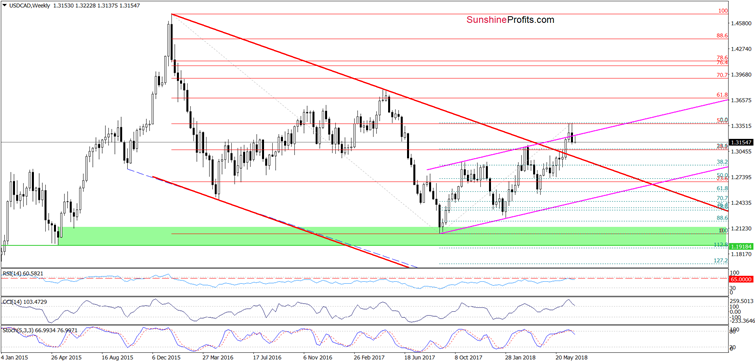
On Friday, we wrote that USD/CAD climbed to the 50% Fibonacci retracement in the previous week, which resulted in a pullback. This week currency bulls tried to go higher once again, but their failed for the second time in a row, which does not look very good - especially if we take into account the current levels of the CCI and the Stochastic Oscillator.
On top of that, the RSI climbed to its highest level since May 2017. Did something important happen then? Yes. Such high reading of this indicator preceded a significant move to the downside in the following weeks.
Taking this fact into account and two unsuccessful attempts to go above the 50% Fibonacci retracement, it seems to us that further deterioration is just around the corner.
On the weekly chart, we see that currency bears took USD/CAD lower as we had expected. Thanks to their attack the exchange rate closed the previous week below the upper border of the punk rising trend channel, invalidating the earlier breakout (and making our short positions profitable).
This is a bearish sign, which suggests that a bigger move to the downside is just a matter of time – especially when we factor in the fact that the exchange rate tested this resistance line this week, but currency bulls didn’t manage to go higher.
This price action is visible much better from a short-term perspective so let's take look at the daily chart below.
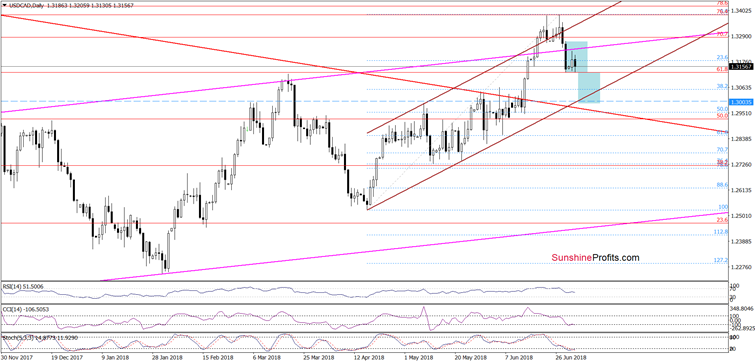
From this perspective, we see that USD/CAD verified the earlier breakdown under the pink resistance line, which increases the probability that we’ll see a fresh July low in the coming days.
This scenario will be even more likely if the pair closes today’s session (or one of the following) under 1.3129, where the lower border of the blue consolidation is. If we see such price action, currency bears will likely try to reach our initial downside targetaround 1.2983, where the lower border of the brown rising trend channel (marked on the daily chart) is.
Finishing today’s alert, it is also worth noting that slightly below this level, the size of the downward move will correspond to the height of the consolidation, which increases the likelihood of falling into this area if the bears show their strength and determination by breaking through the lower line of the aforementioned consolidation.
If you enjoyed the above analysis and would like to receive free follow-ups, we encourage you to sign up for our daily newsletter – it’s free and if you don’t like it, you can unsubscribe with just 2 clicks. If you sign up today, you’ll also get 7 days of free access to our premium daily Oil Trading Alerts as well as Gold & Silver Trading Alerts. Sign up now.
Nadia Simmons
Forex & Oil Trading Strategist
Przemyslaw Radomski
Founder, Editor-in-chief
Sunshine Profits: Gold & Silver, Forex, Bitcoin, Crude Oil & Stocks
Stay updated: sign up for our free mailing list today
* * * * *
Disclaimer
All essays, research and information found above represent analyses and opinions of Nadia Simmons and Sunshine Profits' associates only. As such, it may prove wrong and be a subject to change without notice. Opinions and analyses were based on data available to authors of respective essays at the time of writing. Although the information provided above is based on careful research and sources that are believed to be accurate, Nadia Simmons and his associates do not guarantee the accuracy or thoroughness of the data or information reported. The opinions published above are neither an offer nor a recommendation to purchase or sell any securities. Nadia Simmons is not a Registered Securities Advisor. By reading Nadia Simmons’ reports you fully agree that he will not be held responsible or liable for any decisions you make regarding any information provided in these reports. Investing, trading and speculation in any financial markets may involve high risk of loss. Nadia Simmons, Sunshine Profits' employees and affiliates as well as members of their families may have a short or long position in any securities, including those mentioned in any of the reports or essays, and may make additional purchases and/or sales of those securities without notice.
© 2005-2022 http://www.MarketOracle.co.uk - The Market Oracle is a FREE Daily Financial Markets Analysis & Forecasting online publication.