


CRB Commodity Index Chart Analysis Trend Forecast
Commodities / CRB Index Jul 02, 2018 - 11:38 AM GMTBy: Austin_Galt

 Pattern – price has been in a downtrend since the 2011 high and the current price action looks corrective in nature. An ABC correction looks to be playing out with price still to put in a wave C high.
Bollinger Bands – price is back at the middle band and I am looking for support to kick in here.
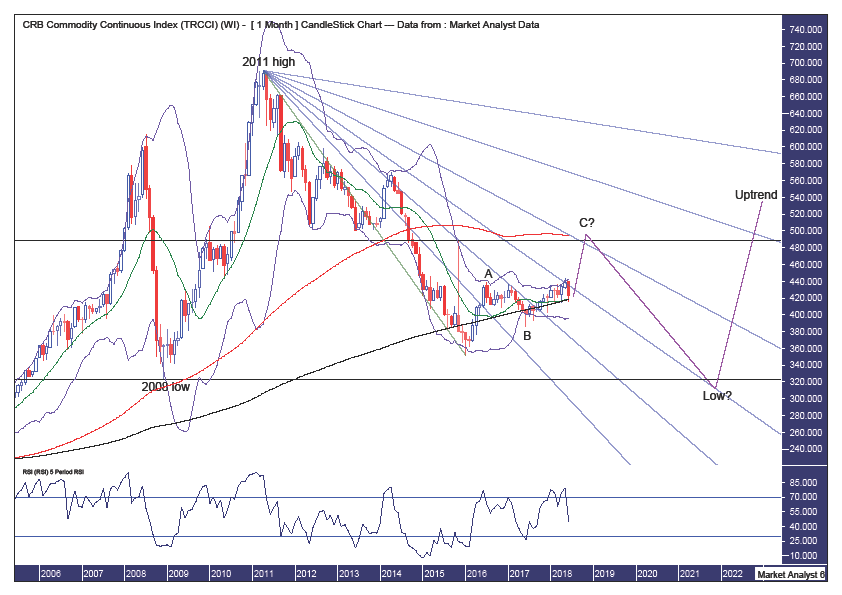
Fibonacci – price is at the 50% angle which looks to be providing some resistance. Ultimately, I favour price to break this resistance and eventually top out around resistance from the 61.8% angle. If that occurs then I will be looking for the downtrend to resume with price trading between the 50% and 61.8% angles with the final low coming in at support from the 50% angle. Let’s see.
Horizontal lines – the upper line denotes the spike high of 488 set in November 2015 and I am looking for price to nudge above this level before turning back down, thereby creating a false break high. The lower band denotes the 2008 low of 322 and my expectation is that the final bear market low will trade marginally below this level. Why? The quarterly chart analysis will answer that.
Moving averages – in a bullish position with price now at support from the 200 monthly average (black). I am looking for price to rally up to the 100 monthly average (red) which I expect to act as resistance.
RSI – has dipped into weak territory but if I am correct in forecasting a rally now then a switch back into strong territory should be just around the corner.
Quarterly Chart
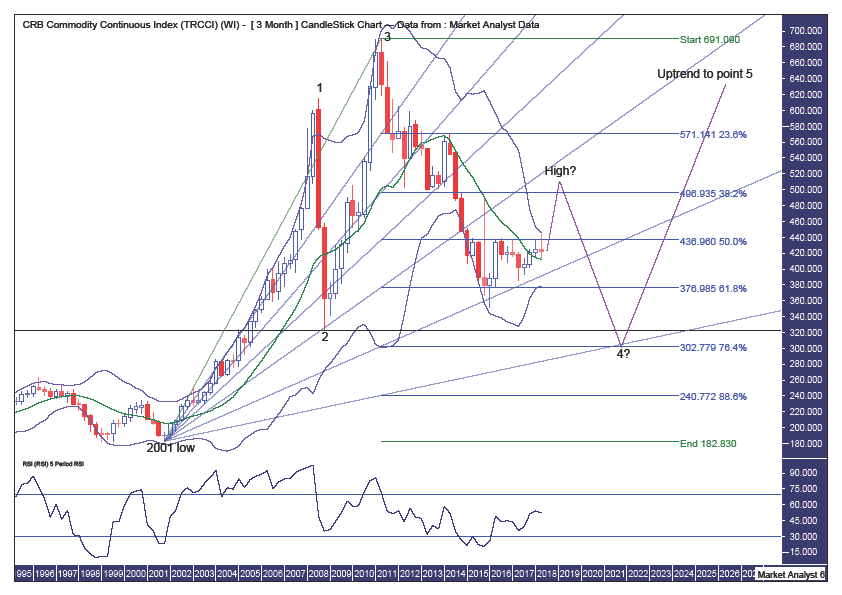
Pattern – I believe a massive 5 point broadening top is playing out with price still tracing out its way to a point 4 low.
Bollinger Bands – the bands are tightening with price finding resistance at the upper band and support at the middle band. I now expect price to rally and push into the upper band.
Fibonacci – price recently found support at the 76.4% angle and I am looking for a rally back up to around the 61.8% angle which should provide resistance. Personally, I favour price to fall a bit short of that 61.8% angle. Ultimately, I am looking for the final point 4 low to be around support from the 88.6% angle. Price recently clipped the 61.8% retracement level and a common occurrence is that price then rallies back up to the 38.2% retracement level which, in this case, lies at 496. After that, I am looking for the point 4 low to get down to around the 76.4% retracement level of 302. This level looks to intersect with the 88.6% angle in 2001 so that is some potential timing for the final point 4 low.
RSI – is marginally in strong territory and generally trending up. A good sign for the bulls.
Summing up – as we head into the second half of 2018 I believe the CRB Commodity Index is set for a solid rally in the vicinity of 20% from current levels.
By Austin Galt
Austin Galt has previously worked as a stockbroker and investment banker while studying technical analysis for over two decades. He is also the author of the book White Night: A Colombian Odyssey
Email - info@thevoodooanalyst.com
© 2018 Copyright The Voodoo Analyst - All Rights Reserved
Disclaimer: The above is a matter of opinion provided for general information purposes only and is not intended as investment advice. Information and analysis above are derived from sources and utilising methods believed to be reliable, but we cannot accept responsibility for any losses you may incur as a result of this analysis. Individuals should consult with their personal financial advisors.
Austin Galt Archive |
© 2005-2022 http://www.MarketOracle.co.uk - The Market Oracle is a FREE Daily Financial Markets Analysis & Forecasting online publication.