


Stock Market Step Back
Stock-Markets / Stock Markets 2018 Jul 02, 2018 - 11:34 AM GMTBy: Andre_Gratian

 Current Position of the Market
SPX: Long-term trend – The bull market is continuing with a top expected in the low 3000s.
Intermediate trend – Due to recent market action, the intermediate trend from 2873 may be extending its corrective phase.
Analysis of the short-term trend is done on a daily basis with the help of hourly charts. It is an important adjunct to the analysis of daily and weekly charts which discusses the course of longer market trends.
Daily market analysis of the short term trend is reserved for subscribers. If you would like to sign up for a FREE 4-week trial period of daily comments, please let me know at ajg@cybertrails.com
A Step Back
Market Overview
Last week, I started my article with “Next week, the bulls will have their best opportunity yet since the consolidation began to turn the trend in their favor.” Instead, they took a significant step back which could extend the corrective period by several more days and perhaps weeks. If the rally was to extend to new highs right away, the 2740 level should have held and provided a platform from which to launch a move that would go and challenge the 2872 high. Instead, that support totally collapsed and sent the index plummeting to the next level at 2700.
This may be a strategic withdrawal by the bulls, to a position from which they can launch a new offensive. In fact, they have already attacked 2740 (which has now become resistance) twice, but both have resulted in failures, and it is not certain if they can make another attempt at overcoming that level -- which is key to re-establishing an uptrend! Much depends on how significant the downside reversal which occurred on Friday will turn out to be.
The onus has now shifted to the weekly trend which has been weakening, although it has not yet given a convincing reversal signal. The fact that the daily trend saw an opportunity to reverse positively evaporate on Friday was not a good sign, and we must wait until next week to see if the bulls can regroup and start another offensive. If they cannot, it is possible that the correction is structurally expanding into a larger triangle which is not yet complete.
Chart analysis (The charts that are shown below are courtesy of QCharts)
SPX daily chart
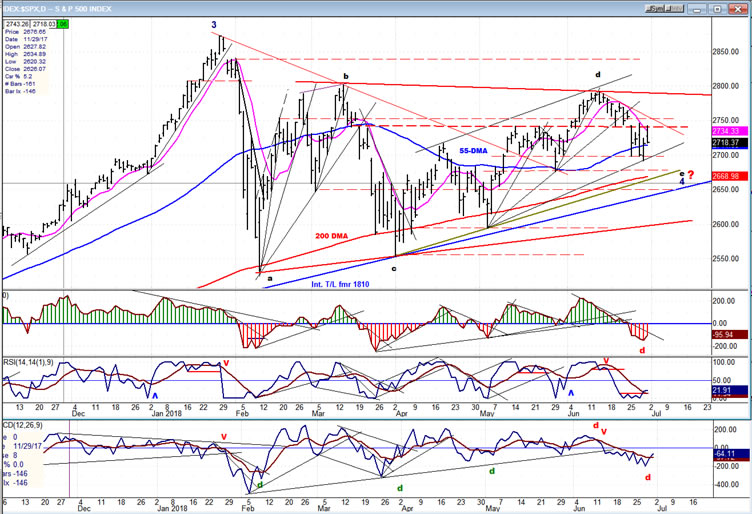
SPX is in a short-term downtrend and is tryng to hold its new support level of 2700. If it does not, there is good support about 30 points lower where a trend line makes a junction with the 200 DMA. 2670 also happens to be the projection which is derived from the congestion level which formed at the 2750 level.
On Friday some early strength drove the index to 2743, but it could go no further and spent most of the rest of the day creating a distribution pattern which was completed precisely at 3:00 pm. At that time, a decline started which continued into the last minute of the day, and caused a loss of nineteen points from its start, although SPX still managed to retain a gain of two points for the day.
The bad news is that the closing price of 2719 will probably not be the end of Friday’s decline, since enough distribution was created during the day to suggest that it could keep going down to 2705 before the count has been exhausted. The good news is that this will permit prices to hold above the new support level of 2700, but the bull’s glee may be short-lived because, if they cannot generate another rally which surpasses 2743, it will keep the short-term trend in a pattern of lower highs, and the index may continue to correct at least until it reaches the suggested target of 2670.
I mentioned in the Overview that the onus is now on the weekly trend to hold up. As of Friday’s close, both of the SPX’s weekly momentum oscillators had come straight down to the zero line, thereby reaching neutral. A lower close by next Friday would tip them into the red turning the trend negative. As you can see, the daily oscillators have all given a sell signal, and the amount by which the CCI has exceeded its former low (while price did not) has caused some negative divergence with the price, perhaps requiring a little time to repair the damage which has been done. Of course, if the index decides to surpass 2743 next week, it would be out of the woods providing that momentum carries it above 2765.
The suggestion that SPX may be expanding its structure into a larger triangle is pure speculation for now. Longer term, we are still looking for a move up to about 3000 before a much larger correction begins.
SPX hourly chart
Looking at this chart, there is no question that we have reverted from a short-term uptrend to a short-term downtrend. From the green support line of 2677, we rose to 2791 and started to retrace. We held at 2740 for a little while, and collapsed down to 2700 before trading between that level and 2740 while we decide in which direction we want to go next. After completing the decline which started on Friday, if we cannot exceed 2740 on the next rally, especially if we cannot get past those lower downtrend lines before turning down again, the odds are pretty good that we will go lower and test support at 2670.
As discussed earlier, we should expect more decline early next week down to about 2705. What happens after that will determine if we continue to trade in this range, or break out into another. That should be resolved by the end of next week. Since overhead congestion gives us a count to 2670, that should be our expectation; but since these counts are not absolute, let’s let the market prove that this is what it wants to do.
The oscillators are confirming the short-term action. Some minor positive divergence appeared in the CCI as well as in the A/Ds when we reached Friday’s top, and if that positive divergence reappears and increases at our next minor low, it will tell us that the odds of moving above 2740 on the next rally has increased-- perhaps high enough to at least fill the open gap above. The next test would then be about whether or not we can extend the move beyond the red downtrend line. The bulls primary concern right now, is to reverse those daily indicators into an uptrend and stop the deterioration which is taking place at the weekly level.

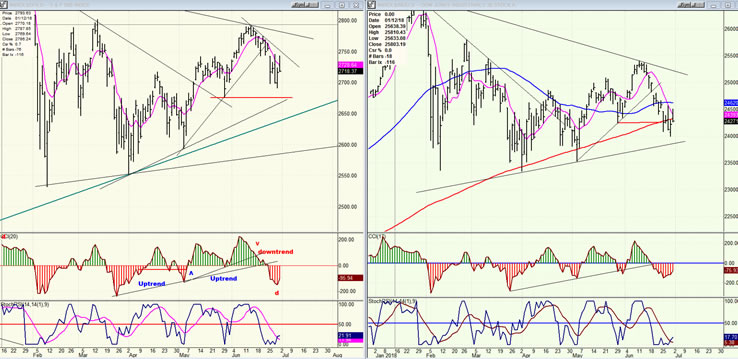
SPX vs DJIA (daily charts)
A little while ago, I pointed out that the DJIA was beginning to show some divergence with SPX and that it might be a sign that more correction lay ahead. Not only did that turn out to be correct, but the relative weakness of the DJIA to SPX has increased. This is easily seen with the two daily charts side by side. Does this mean that the correction will continue? We’ll see, but note that, for the third time, DJIA has challenged its red 200-DMA, and this time it has gone a little deeper than the previous two. That makes it a little more vulnerable than SPX. This is why what happens in the course of the next week or two is so important. DJIA must return to trading on a par with SPX.
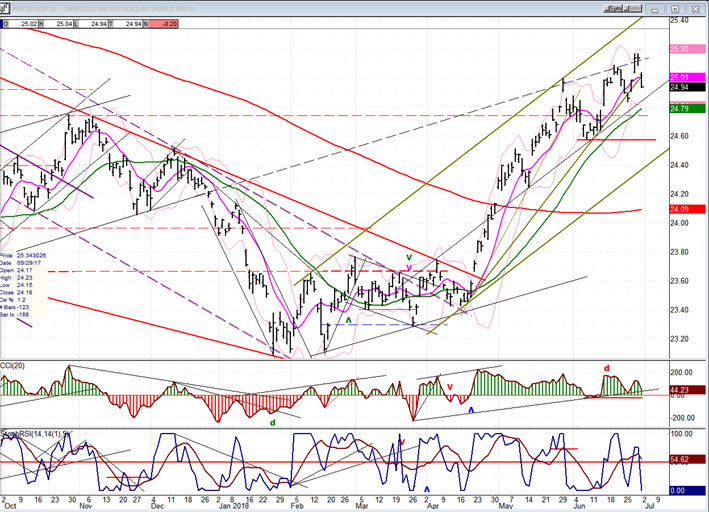
UUP (dollar ETF) Weekly
UUP pulled back on Friday but remains in an uptrend until it shows more weakness. A close below 2480 would start to look as if a correction were underway.
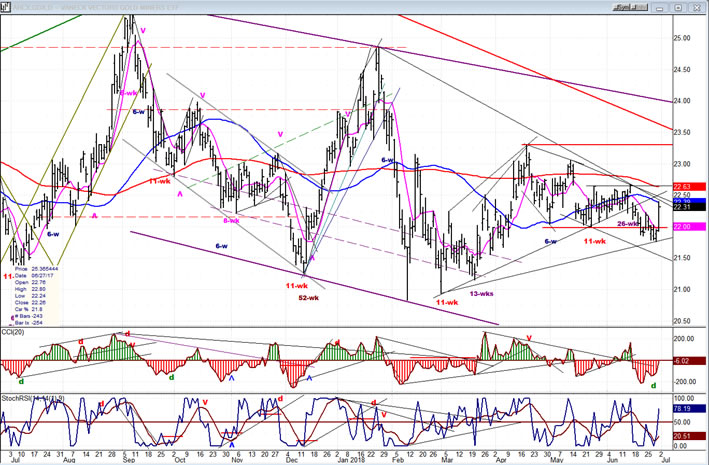
GDX (Gold miners ETF)
GDX responded to the weakness in the dollar with a good counter-move which could be the start of an uptrend if the dollar continues to retrace. Next week’s action is important to both indexes. Neither has made a decisive move yet, but could be preparing to do so.
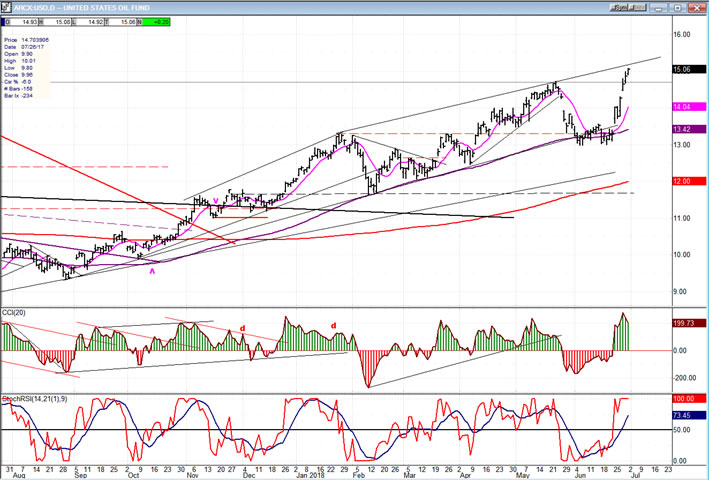
USO (United States Oil Fund)
The consolidation in USO was short-lived. The original projection was 14.50-15.00, so this could still be the end of the previous move and not the beginning of a new uptrend. Next week should clarify this, also.
Summary
After dropping below 2740 down to the 2700 support level and rallying twice to 2740 before retracing, SPX has set up new trading parameters. Breaking above or below these limits should determine the direction of the next short-term trend. Whichever direction comes next, the index is still expected to challenge its former high in the not too distant future.
Andre
For a FREE 4-week trial, send an email to anvi1962@cableone.net, or go to www.marketurningpoints.com and click on "subscribe". There, you will also find subscription options, payment plans, weekly newsletters, and general information. By clicking on "Free Newsletter" you can get a preview of the latest newsletter which is normally posted on Sunday afternoon (unless it happens to be a 3-day weekend, in which case it could be posted on Monday).
Disclaimer - The above comments about the financial markets are based purely on what I consider to be sound technical analysis principles uncompromised by fundamental considerations. They represent my own opinion and are not meant to be construed as trading or investment advice, but are offered as an analytical point of view which might be of interest to those who follow stock market cycles and technical analysis.
Andre Gratian Archive |
© 2005-2022 http://www.MarketOracle.co.uk - The Market Oracle is a FREE Daily Financial Markets Analysis & Forecasting online publication.