Gold Extremely Oversold Suggests Imminent Bottom
Commodities / Gold & Silver Sep 14, 2008 - 06:03 PM GMTBy: Clive_Maund

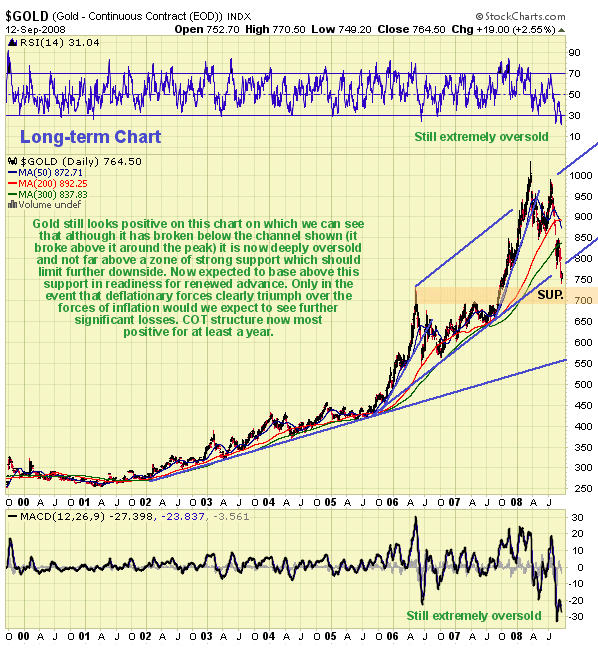
 A confluence of factors suggests that we have just seen the bottom in gold and silver, or if not that the bottom is very close. The last update called the bottom too early as renewed dollar strength resulted in another downleg in the metals. After the recent heavy losses it may come as something of a surprise to many that the long-term chart for gold still looks positive, with the drop looking like a fairly normal correction.

As we can see, although the decline has taken the price some way below the 300-day moving average - the first time this happened since the bullmarket in gold began - and beneath the trendline shown on our chart, the price has not breached the first really important underlying support level, that arising from the big 2006 - 2007 trading range, and thus far it has barely touched the upper boundary of this strong support. This key support level can be expected to prevent significant further losses.
.,, . With regard to the 2 factors mentioned above which could be interpreted as meaning that the bullmarket is over, we can with the benefit of hindsight observe that the rate of ascent of the long-term 200 and 300-day moving averages had become unsustainably steep, thus a correction well below them had become necessary to moderate their rate of ascent, and with respect to the trendline breach, just as gold broke out of the channel to the upside early this year and then reversed, it can do just the same in the opposite direction - for the support from the 2006 - 2007 trading range is far more important than this trendline, which can in any case be adjusted. Although we may see some backing and filling to slightly lower levels with gold dropping back into the support zone to form an intermediate base area in coming weeks, we are thought to be very close to the lows here. Finally, before leaving this gold chart we should note the extremely oversold condition as shown by the RSI and MACD indicators at the top and bottom of the chart.

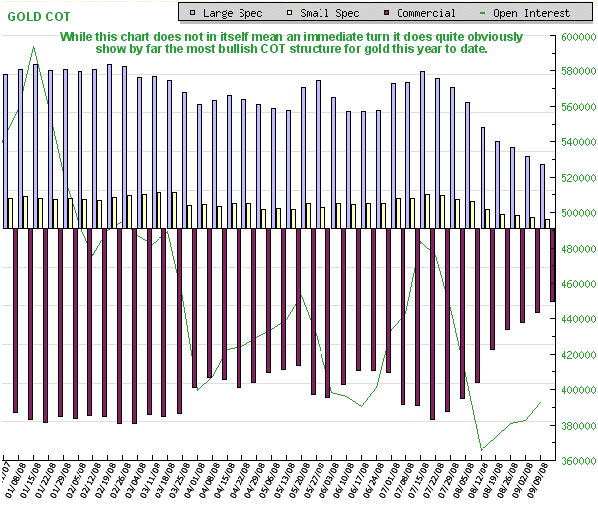
The gold COT chart is most interesting at this time, for it shows that both the Large and Small Specs have been abandoning the field in disgust in recent weeks, whilst at the same time the Commercials have been scaling back their short positions. This is exactly what we want to see as an important favorable precondition for another major rally. This is the best it has looked for at least a year, and it suggests that another major uptrend is not far over the horizon.

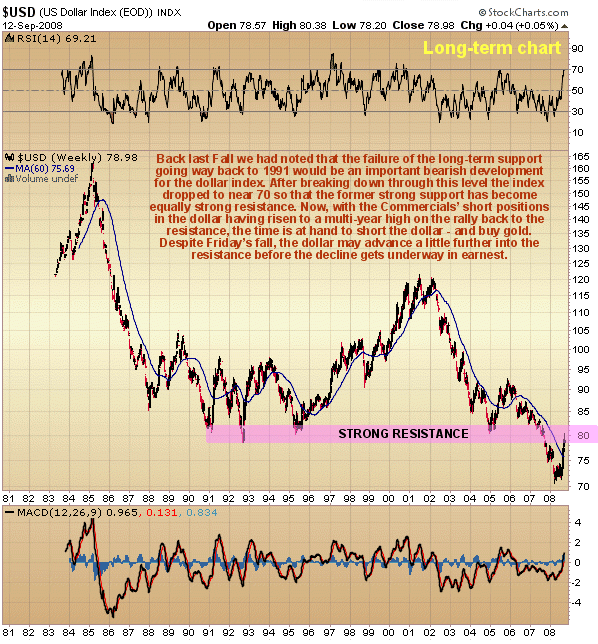
So if gold now looks good, what about the dollar? For gold to go up it will certainly help if the dollar spike of recent weeks goes into reverse. It was opined on the site some days back that the dollar looks set to run to the 86 area on the index. However this view has since been amended, not because of the big drop on Friday, but because of the 2 factors now presented here. Last year we had commented on the importance of the long-term support level at 79 - 81 on the dollar index that goes back many years to the early 90's, as we can see on the accompanying chart, and pointed out that if it broke below it would be a very bearish development for the dollar. Well, as we know, it did break below it and the dollar proceeded to drop back to a point very close to 70, but then in recent weeks we have had the spike back up to about 80, partly associated with the Fannie and Freddie bailout.
One commentator has in recent days labelled the entire pattern from the 1992 low to the point at which it broke down late last year as a Head-and-Shoulders top. While it is not considered to be that because such a top area has to come after a major advance, not after a major drop as this did, the importance of the line of support, now resistance, at 79 - 81 is very clear, and as is often the case following the breakdown from the Head-and-Shoulders top, there frequently follows a final pullback to the support/resistance line before the decline gets underway in earnest, which is what we appear to have just seen. Despite the sharp drop on Friday, there is thought to be a fair chance that the dollar will push ahead a little further, perhaps as far as 82, before the advance has completely exhausted itself, possibly forming a small Dome shaped top area, which would be typical. Such action would allow gold to base in or slightly above its support zone ahead of the next major advance. The other key factor pointing to an imminent reversal by the dollar to the downside is the Commercial's short positions in it, which have risen to a multi-year high and experience has shown that it is most unwise to bet against them.
Finally, we saw a powerful reversal in Precious Metals stocks late last week, with the HUI index rising over 10% in one day on Friday, after looking like it had breached a crucial support level. This is typical market behaviour at a reversal - break below support briefly, trigger lines of stops and then come roaring back. Such moves are thought to be engineered by big money in order to mop up vast tranches of stock on the cheap, with the little guy left lying in the ditch after having been fleeced.
What about the potential implosion into deflationary depression detailed in the article CATASTROPHE THEORY and the US ECONOMY ? - might that not be an explanation for the recent collapse in commodities and surge in the dollar - and if so could this not continue to lay waste to the commodity sector generally? Yes, it could, but the latest indications in gold, silver, the dollar and their COT charts and in the performance of Precious Metals stocks is that while this risk continues to lurk in the background, and while deflationary forces are gathering stength in the background, it might not take center stage for a while yet, maybe not for a year or two, and in the meantime the hyperinflationary effects of the enormous increases in the money supply aggravated by government largesse in bailing out major banks and other big institutions has the potential to generate an enormous rally in Precious Metals.
The Fannie and Freddie bailout was not about providing a genuine solution to the problems that face the US economy, its purpose was to buy more time for the Fed, the government and Wall St, rather like a child reinforcing the walls of a sandcastle on the beach as the tide comes in around it.
By Clive Maund
CliveMaund.com
For billing & subscription questions: subscriptions@clivemaund.com
© 2008 Clive Maund - The above represents the opinion and analysis of Mr. Maund, based on data available to him, at the time of writing. Mr. Maunds opinions are his own, and are not a recommendation or an offer to buy or sell securities. No responsibility can be accepted for losses that may result as a consequence of trading on the basis of this analysis.
Mr. Maund is an independent analyst who receives no compensation of any kind from any groups, individuals or corporations mentioned in his reports. As trading and investing in any financial markets may involve serious risk of loss, Mr. Maund recommends that you consult with a qualified investment advisor, one licensed by appropriate regulatory agencies in your legal jurisdiction and do your own due diligence and research when making any kind of a transaction with financial ramifications.
Clive Maund Archive |
© 2005-2022 http://www.MarketOracle.co.uk - The Market Oracle is a FREE Daily Financial Markets Analysis & Forecasting online publication.


