


Traders Buy Markets When They Cry, Sell When They Yell!
Stock-Markets / Stock Markets 2018 Jun 29, 2018 - 01:36 PM GMTBy: Chris_Vermeulen

 We have been pouring over the charts to find out what to expect over the rest of 2018 and our advanced predictive modeling tools are showing us a few key elements that all traders need to be aware of. So, let’s get right to it.
First, the NASDAQ has likely neared or reached its peak near 7400 for the next few months. Don’t expect the NQ to move much beyond 7400 and don’t expect a lot of volatility in the NQ over the next few months. Our research shows the NQ should stall near 7400 and volatility should decrease through September (possibly).
Second, the ES/YM/Transportation sectors are poised for a very healthy rally over the next 3+ months or longer. We believe a massive capital shift is underway that will drive capital from foreign markets and tech stocks into Blue Chips, Small Caps and the Transportation sector.
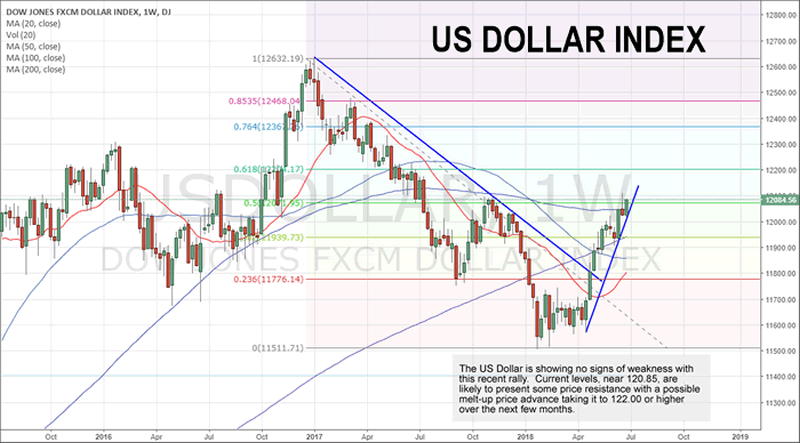
Third, the US dollar will likely continue to appreciate towards 122 after a brief price stall near 120.85. 120.85 is resistance that will probably cause the price advance to stall a bit before pushing higher. The next resistance level is near 122 and is our next higher target.
Lastly, overall volatility will likely decrease in the general market as price trend continues to unfold. The recent spike in the VIX has a lot of people wondering if we could see some type of deeper market rotation. Our opinion is that these projected upside trends will begin after the July 4th trading week and surprise many traders. Shorts will get squeezed very quickly as this upside trend unfolds.
Now, let’s take a look at some charts. This, a Weekly US Dollar chart, shows the recent price channel breach as well as the clearly defined upside price trend. 120.85 is currently resistance near the 50% retracement level of the previous price downtrend. This level will likely cause the price to stall a bit before advancing higher to the 122.00 level. Overall, until something changes in the global markets or price pushes above the 123.65 level, we expect the US Dollar to continue to advance.
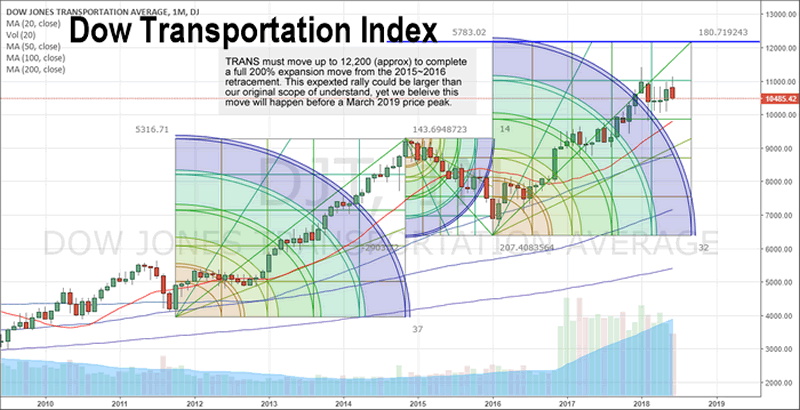
This, the Monthly Dow Jones Transportation Index, shows us the scope and amplitude of recent price swings as well as the price alignment of price rotation over the past 3+ years. Notice that the last Fibonacci Arc Square aligns with price pullbacks and retracements much like the one originating near 2012 through 2014. The point of this exercise is to understand how the price is supposed to react within this expansion and to attempt to predict the future upside targets based on these moves. It is our opinion that the Transportation index will rally to near $12,200 before this move is over. The reasoning for this is simple – given current and past price rotation, the alignment of the Fibonacci arc suggests that $12,200 will be the ultimate price peak. Simply put, we just align the Fibonacci arc to price rotation and see where the final outcome for the price is located.
Lastly, this Monthly YM Chart shows us a very clear picture of what to expect over the long term if our predictive analysis and projected price/cycle analysis is correct. The YM should rally to new highs before the end of this year while potentially stalling near the end of 2018 or within Q1 of 2019. This stall/peak formation will result in a slight price correction (of likely 3~6%) before prices, again, begin another upside move. These Fibonacci price circles help us determine projected price targets as well as assist us in understanding current and past price rotation. The key to all of this is overlaying different analysis and predictive modeling systems that help us understand what to expect in the future. From this analysis, we can then take at look at these types of “trigger point models” that helps us to understand where and when the price may attempt to reach peaks or troughs.
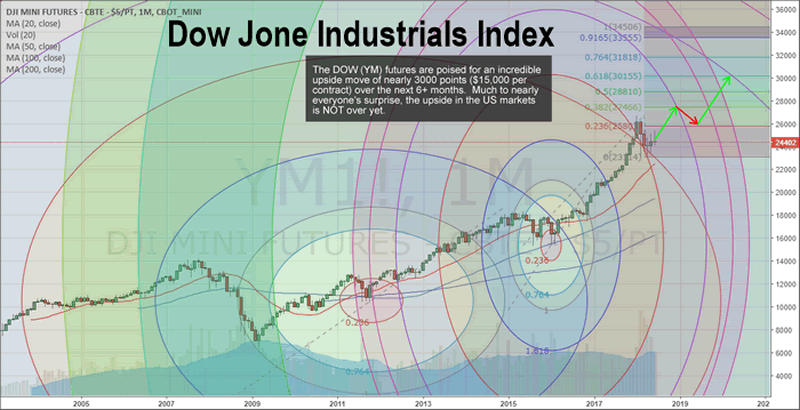
The current price rotation in the market, with the ES trading near 2720, would indicate that the ES, YM and other Blue Chips may be setting up for a massive upside move. The YM alone could rally nearly +3000 points ($15k per contract) and the ES could rally +100 points (+$5k per contract) over a fairly short period of time (3~8+ weeks). This is a tremendous opportunity for traders. Get ready for an incredible opportunity for profits and let us help you stay ahead of these moves.
Please take a minute to visit www.TheTechnicalTraders.com to learn how we can help you find and execute better trading solutions, better research and provide a top-tier solution for active traders. If you like our research and find it helps you, then consider joining our other valued members in supporting our work and taking advantage of our solutions for active traders. Want to know where this market is headed and what to expect throughout the end of this year and beyond – our members already know what our predictive modeling systems are suggesting for the next 5+ months.
Do These Charts Make Sense or Confuse You? It doesn’t matter, just use our easy to follow trade alerts complete with entry, stop, and price targets! JOIN NOW AND TRADE LIKE A PRO!
Chris Vermeulen
www.TheTechnicalTraders.com
Chris Vermeulen has been involved in the markets since 1997 and is the founder of Technical Traders Ltd. He is an internationally recognized technical analyst, trader, and is the author of the book: 7 Steps to Win With Logic
Through years of research, trading and helping individual traders around the world. He learned that many traders have great trading ideas, but they lack one thing, they struggle to execute trades in a systematic way for consistent results. Chris helps educate traders with a three-hour video course that can change your trading results for the better.
His mission is to help his clients boost their trading performance while reducing market exposure and portfolio volatility.
He is a regular speaker on HoweStreet.com, and the FinancialSurvivorNetwork radio shows. Chris was also featured on the cover of AmalgaTrader Magazine, and contributes articles to several leading financial hubs like MarketOracle.co.uk
Disclaimer: Nothing in this report should be construed as a solicitation to buy or sell any securities mentioned. Technical Traders Ltd., its owners and the author of this report are not registered broker-dealers or financial advisors. Before investing in any securities, you should consult with your financial advisor and a registered broker-dealer. Never make an investment based solely on what you read in an online or printed report, including this report, especially if the investment involves a small, thinly-traded company that isn’t well known. Technical Traders Ltd. and the author of this report has been paid by Cardiff Energy Corp. In addition, the author owns shares of Cardiff Energy Corp. and would also benefit from volume and price appreciation of its stock. The information provided here within should not be construed as a financial analysis but rather as an advertisement. The author’s views and opinions regarding the companies featured in reports are his own views and are based on information that he has researched independently and has received, which the author assumes to be reliable. Technical Traders Ltd. and the author of this report do not guarantee the accuracy, completeness, or usefulness of any content of this report, nor its fitness for any particular purpose. Lastly, the author does not guarantee that any of the companies mentioned in the reports will perform as expected, and any comparisons made to other companies may not be valid or come into effect.
Chris Vermeulen Archive |
© 2005-2022 http://www.MarketOracle.co.uk - The Market Oracle is a FREE Daily Financial Markets Analysis & Forecasting online publication.