


For Stocks, the Line in the Sand Has been Drawn
Stock-Markets / Stock Markets 2018 Jun 29, 2018 - 01:25 PM GMTBy: EWI

See illustrations of complete bull and bear market cycles
You may have heard pundits on financial television say something like, "I see support for the Dow at this price level," or "This stock should experience some resistance at that price level."
So, what do these analysts mean by support and resistance?
Well, according to Technical Analysis of Stock Trends, the classic book by Robert Edwards and John Magee, support means buying in sufficient volume to prevent any further downward movement in prices for an appreciable period. Resistance is just the opposite. It means selling in enough volume to satisfy all bids, thereby preventing prices from going any higher for a while.
On a chart, after a support line is meaningfully broken, prices tend to move more freely downward. The opposite applies when lines of resistance are broken.
When support and resistance have long held, or have been touched several times, the price moves after a breakthrough can be quite dramatic.
With that in mind, here's a chart and commentary from our June 22 U.S. Short Term Update (wave labels available to subscribers):
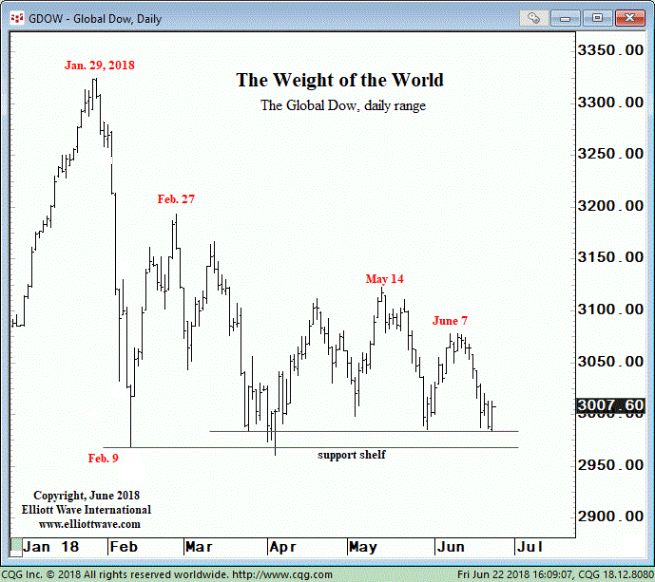
The Global Dow comprises 150 global blue-chip stocks, including all 30 components of the DJIA. Unlike the DJIA, which is a price-weighted index, the Global Dow is equal-weighted so that price moves in large stocks hold no disproportionate sway over the index. The Global Dow peaked on January 29, the day after the DJIA, and traced out [an Elliott wave pattern downward] to February 9, along with the U.S. blue-chip stock indexes.
But notice how each successive rally thereafter has topped at a lower high despite the hefty representation of U.S. blue chips...
Heavy is an understatement, because:
"...the U.S. accounts for more than 42% of the total index's valuation."
Needless to say, if the Global Dow's support shelf gives way, it could have profound implications for U.S. stocks, as well.
Jump on once-in-a-lifetime opportunities and avoid dangerous pitfalls that no one else sees coming. We can help you prepare for opportunities and side step risks that will surprise most investors. You can get deeper insights in Elliott Wave International's new free report: 5 "Tells" that the Markets Are About to Reverse. The insights that you'll gain are especially applicable to the price patterns of key financial markets, including the stock market, now.
This article was syndicated by Elliott Wave International and was originally published under the headline For Stocks, the Line in the Sand Has been Drawn. EWI is the world's largest market forecasting firm. Its staff of full-time analysts led by Chartered Market Technician Robert Prechter provides 24-hour-a-day market analysis to institutional and private investors around the world.
© 2005-2022 http://www.MarketOracle.co.uk - The Market Oracle is a FREE Daily Financial Markets Analysis & Forecasting online publication.