


Dow Breaks Below its 200 Dma. A Potentially Bearish Sign for Stocks
Stock-Markets / Stock Markets 2018 Jun 26, 2018 - 07:09 PM GMTBy: Troy_Bombardia

Most of our recent medium-long term stock market studies have been bullish. Here’s a bearish study, and why I don’t think it’s as bearish as the results suggest.
The Dow Jones Industrial Average has closed below its 200 daily moving average for the first time in 501 days. This is a pretty long streak.
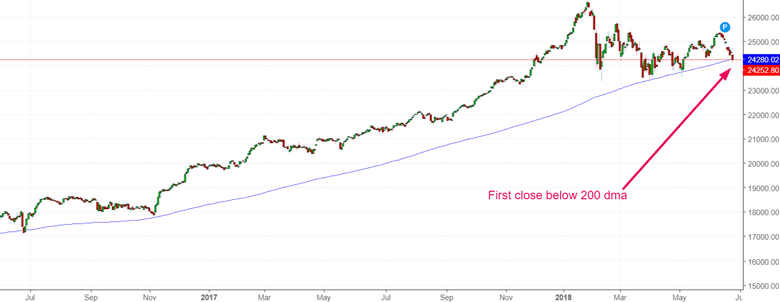
There have only been 8 historical cases in which the Dow rallied at least 400 days before falling below its 200 dma.
- July 23, 1996
- October 15, 1987
- May 23, 1956
- July 23, 1946
- April 26, 1937
- October 21, 1929
- March 3, 1926
- May 1, 1906
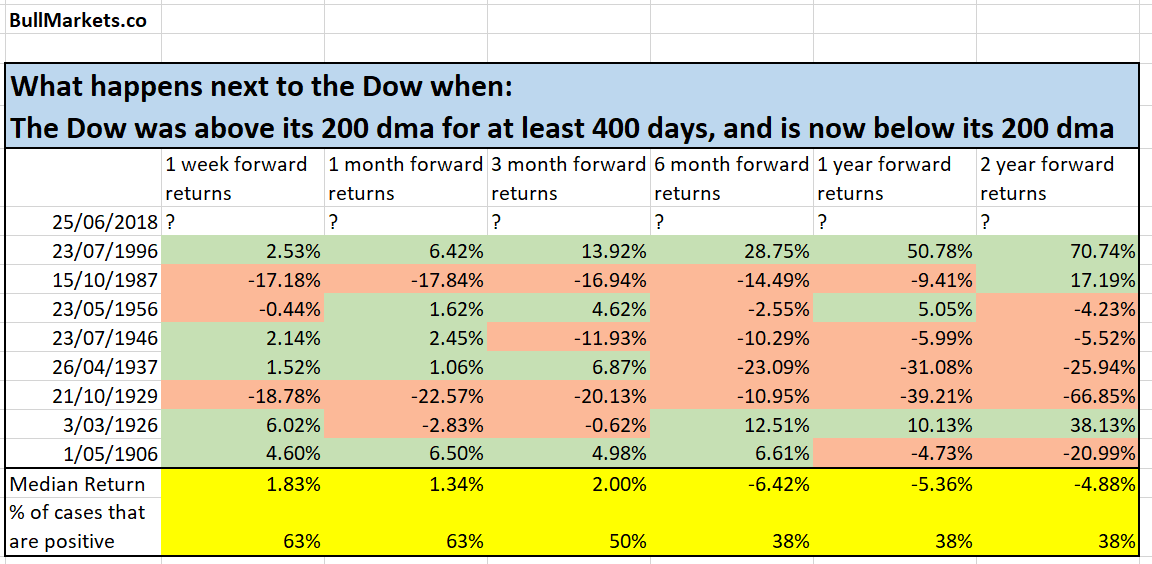
Here’s what happens next to the Dow when it closes below its 200 dma for the first time in at least 400 days.
Click here to download the data.
Conclusion
As you can see, the stock market’s 6 month – 2 year forward returns are pretty bearish. Several large crashes happened after the Dow closed below its 200 dma for the first time in at least 400 days.
- 1987 crash (“significant correction)
- 1937 crash (bear market)
- 1929 crash (bear market)
However, 2 massive rallies also occurred after the Dow closed below its 200 dma for the first time in 400 days:
- 1996 (up 70% 2 years later).
- 1926 (up 38% 2 years later).
I don’t think the bearish cases are going to play out right now.
- Before yesterday, the Dow had spent 501 days above its 200 daily moving average.
- The 1929 bearish case saw the Dow rally much more: it spent 787 days above its 200 daily moving average (a year more than the current case).
- The 1987 bearish case saw the Dow rally much more: it spent 715 days above its 200 daily moving average (a year more than the current case).
In conclusion, this is a potential medium-long term bearish sign for the stock market. But never will there be a time in which all the studies are bullish or all the studies are bearish.
The majority of medium-long term studies are bullish for the stock market right now. Hence I remain bullish.
By Troy Bombardia
I’m Troy Bombardia, the author behind BullMarkets.co. I used to run a hedge fund, but closed it due to a major health scare. I am now enjoying life and simply investing/trading my own account. I focus on long term performance and ignore short term performance.
Copyright 2018 © Troy Bombardia - All Rights Reserved
Disclaimer: The above is a matter of opinion provided for general information purposes only and is not intended as investment advice. Information and analysis above are derived from sources and utilising methods believed to be reliable, but we cannot accept responsibility for any losses you may incur as a result of this analysis. Individuals should consult with their personal financial advisors.
© 2005-2022 http://www.MarketOracle.co.uk - The Market Oracle is a FREE Daily Financial Markets Analysis & Forecasting online publication.