


Gold Boxed-in Wating for Bullish or Bearish Breakout
Commodities / Gold & Silver Sep 13, 2008 - 02:33 PM GMTBy: Merv_Burak

 Tuesday took all of the steam out of the two week rally but then that was it. The rest of the week was basically a lateral drift. More downside or continued upside? Let's see.
GOLD : LONG TERM - The week's activity still did nothing for the long term. The P&F chart continues to be bearish and the indicators are all in the negative zone. On the long term the rating remains BEARISH until some more significant market action takes place.
INTERMEDIATE TERM
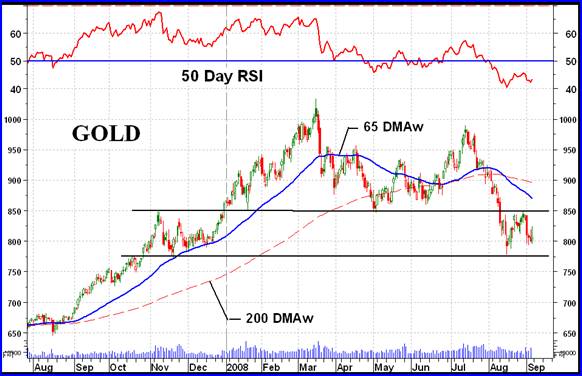
Although Tuesday was a vicious day for the week not much has happened to change any indicators or gold price direction. We had a double top break confirmed a few weeks back and as previously mentioned, the rally was a normal reaction to a break where the price reaches back to the break point before continuing. Well, that's exactly what it looks like it's doing. The reaction just touched the break line and it is once more heading lower. The next confirmation of the trend continuation would be the breaking of the support line at around the $775 level. I had previously also mentioned the reverse situation that gold went through on the way up, a year ago. This is what we might have in store on the way down. Look for more sideways action before the down trend continues.
As the chart clearly shows, gold continues to trade below its intermediate term moving average line and the line remains sloping downwards. The momentum indicator is confirming the price action by remaining in its negative zone below its negative trigger line. The volume indicator is showing greater weakness versus the momentum and is below its negative trigger line. It is also well below its level from a couple of weeks back while the price and momentum are still above their levels. All in all, the intermediate term rating remains BEARISH.
SHORT TERM
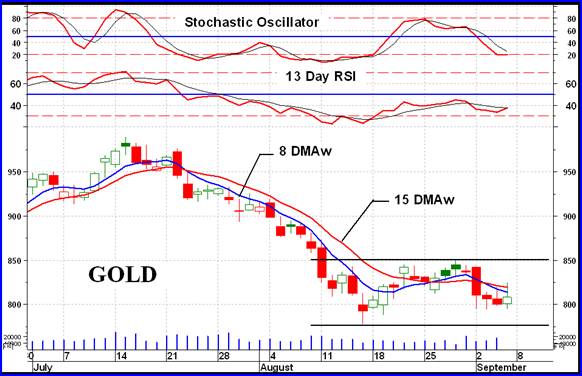
From the short term perspective we may be into a “box” situation where the price of gold continues to move sideways for a while inside a box. The upper and lower levels of the box appear to be the $850 and $775 levels. We'll just have to wait and see if that is the case. Should gold continue inside the box then its next direction will be signaled on a break outside the box. From all indications one would expect such break to be to the down side but I'd wait for the break to happen.
In the mean time the present short term indicators are mostly negative. Gold is below its negative sloping short term moving average line and the momentum indicator remains in its negative zone just very slightly below its trigger line. At this point in time the actual rating for the short term remains BEARISH.
As for the immediate direction of least resistance that doesn't appear to be either up or down. Although the aggressive Stochastic Oscillator is in its negative zone, sitting right on top of its oversold line, it appears to be going nowhere. The very short term moving average line is still above the daily action but the daily action also appears not to be going anywhere. One might say that more of the same, i.e. lateral activity, is to be expected.
SILVER
The last time I showed a silver chart was two weeks ago. It showed silver acting very much like gold except more pronounced on the down side. Once more I'm cutting the commentary short for silver due to time constraints. However, it should be noted that silver closed at a new bear market low on Friday. This may be an indication as to where gold is heading. We'll just have to wait and see.
Looking at the Table of Technical Information and Ratings, Silver has a – NEUTRAL rating for all three time periods. This may be due to different indicators used in the mechanical program that develops the table information. Looking at the chart and my normal indicators silver should have a BEARISH or NEG rating for all three periods.
PRECIOUS METALS STOCKS
WOW! What a week for precious metal stocks. Going through my universe of 160 precious metal stocks (gold & silver) there were only 5 stocks that closed on the up side. With 2 stocks unchanged that leaves 153 stocks on the down side. The AVERAGE decline of these 160 stocks was a hefty 12.1% with the major North American Indices averaging closer to the 13% decline level. We now have the average price of gold stocks at levels they had not seen since 2005.
I have been asked on many occasions to provide readers with my Merv's Gold & Silver 100 Index Table of Technical Information and Ratings. Although I do update this table each week I do not usually make it available. My more encompassing Table of 160 Index stocks IS provided to subscribers each week, as are the separate tables of the various sector Indices.
I expect to be posting my Merv's Gold & Silver 100 Index Table in my Uranium blog site later today so if anyone should like to access this table this week it should be posted before the day's end, most likely late in the evening (Sunday). The Uranium blog is at http://techuranium.blogspot.com and it's free.
From the technical discipline this is not the time for investors or speculators to be in the market on the buy side. Who knows, it just might be the bottom of the market and a good gamble BUT with the direction of stocks and markets moving lower one would be taking huge extra risks buying at this time. Out of the 160 stocks in the 160 Index those that are rated as positive in their trend for all three investment time periods is in the single digit %, ranging from 7% for the short term to 4% for the long term. Not the environment to be buying. Of course, there is an oft stated (fundamental) concept that one should buy when everything is negative, but it could continue negative for a long time and continue negative for a significant extra downside %. A technical concept is to buy when the trend is to the up side and have the odds on your side.
Merv's Precious Metals Indices Table
That's it for this week.
By Merv Burak, CMT
Hudson Aero/Systems Inc.
Technical Information Group
for Merv's Precious Metals Central
For DAILY Uranium stock commentary and WEEKLY Uranium market update check out my new Technically Uranium with Merv blog at http://techuranium.blogspot.com .
During the day Merv practices his engineering profession as a Consulting Aerospace Engineer. Once the sun goes down and night descends upon the earth Merv dons his other hat as a Chartered Market Technician ( CMT ) and tries to decipher what's going on in the securities markets. As an underground surveyor in the gold mines of Canada 's Northwest Territories in his youth, Merv has a soft spot for the gold industry and has developed several Gold Indices reflecting different aspects of the industry. As a basically lazy individual Merv's driving focus is to KEEP IT SIMPLE .
To find out more about Merv's various Gold Indices and component stocks, please visit http://preciousmetalscentral.com . There you will find samples of the Indices and their component stocks plus other publications of interest to gold investors.
Before you invest, Always check your market timing with a Qualified Professional Market Technician
Merv Burak Archive |
© 2005-2022 http://www.MarketOracle.co.uk - The Market Oracle is a FREE Daily Financial Markets Analysis & Forecasting online publication.