US Housing Bear Market Nowhere Near a Bottom
Housing-Market / US Housing Sep 13, 2008 - 11:00 AM GMTBy: John_Mauldin
 The Headwinds to Growing Your Wealth
 - The Wealth of Nations
- Housing: Are We at the Bottom?
- Alt-A is the New Subprime
- 3.5 Million Unemployed and Counting
This week we look at the housing market in some detail. When can we expect it to turn around? Part of the problem is that a new wave of foreclosures is coming due, and this time it is not subprime. And that means more problems for the large financial companies. Also, as predicted here, consumer spending is taking a hit as consumers are finding it increasingly difficult to get credit and a deteriorating labor market is dragging down total spending. There are some very interesting details in the data that was released this week. And we take a quick peek at the outlook for inflation. What is in the pipeline, so to speak? It should make for an interesting letter.
But first, it is finally time to make a very special announcement. Readers are aware that we have been asking you to take a survey on your financial and personality profiles. We are grateful for your response. Tiffani said that she has that nervous/excited feeling you get right before a long-anticipated moment that makes your heart race a little faster. In early summer of next year, we will be releasing our first book written together, to be called Eavesdropping on Millionaires.
The data we are getting is simply amazing. I have seen nothing like it. And to make it more than just a book of numbers, over the next few months Tiffani and I will spend countless hours interviewing millionaires about their personal journeys, philosophies, investments, business successes and woes, lessons learned, families and lifestyles. So far, we have had over 1,000 millionaires (net of their homes) volunteer for the interview. This is the fun part! Listening and exchanging life stories with other people has to be one of the most satisfying and connecting joys of our lives. We plan on doing a series of books, so these interviews will go on for the next year, at the very least.
As you know, I consider my readers to be above par in their insightful feedback (supportive or critical) and intelligence. Tiffani agrees; and we want to know, if you could sit in a room with these millionaires and ask anything, what would you would want to ask? Please send any and all suggestions to us at EU@2000wave.com . And I mean anything; no question is too generic or outlandish for us to consider.
Not only have we had over 1,000 requests for interviews, we have had over 7,000 millionaires (so far) take our extensive survey, out of a total of 16,342, with over 25% coming from outside the US. We have not been able to find a survey done in the past ten years with even half that number! (If you know of any surveys or articles that you think we might have missed, send those along to the above email as well.)
Let me tell you how fascinating it is to start digging into this data. We are comparing our data with other books, surveys, and articles we are researching, not only confirming things we already know but, now, we are finding new and important information.
If you haven't taken the survey yet and want to participate in this research (and we want everyone to take it, as you don't have to be a millionaire – if you are reading this you can take it), please visit: http://survey. frontlinethoughts.com/index. php?sid=12431&lang=en
The Headwinds to Growing Your Wealth
One thing that I find interesting in our research will help me illustrate a very important point I have made in the past few months, and that is the difficult headwinds that people are going to have in their efforts to grow their investment portfolios.
In The Millionaire Next Door, written in 1996, it was stated that 3.5 million households in America (out of a total 100 million households) had a net worth of $1 million or more. Millionaire households accounted for nearly half of all the private wealth in America.
During the ten-year period from 1996 through 2005, the authors projected the wealth held by American households to grow nearly six times faster than the household population. Quoting: "By the year 2005 the total net worth of American households will be $27.7 trillion or more than 20 percent higher than in 1996."
As it turns out, the numbers are far better. Today there are 9.2 million households worth more than $1 million, not including the value of their primary residence. The net worth is almost double their estimate. However, the numbers of new millionaires grew by 21% in 2004, 11% in 2005, 8% in 2006 and 2% in 2007. Can you see a trend here?
In fact, this year it may even reverse. If you go the Federal Reserve data, you find that US national net worth has dropped by over $2 trillion in the two quarters ended last March (that is the latest data). Given the continued drop in home prices and the stock market, it is likely those losses will mount. ( http://www.federalreserve. gov/releases/z1/Current/z1r-5. pdf )
Now, it is not all bad news. We still have total assets of $70 trillion against liabilities of $14.5 trillion. However, much of that wealth is concentrated in the hands of the wealthy, and the real imbalance is in lower-income households. And cash savings are rising at a healthy pace for a change.
The Wealth of Nations
Now, let's review a few factors as to why I think it is going to be harder to get that millionaire status over the next decade than it has been in the past. From 1981 to 2006, our national wealth in terms of the houses we own, stocks we own, real estate, bonds, businesses – everything – our net national wealth (or maybe it's better to say, the prices we put on our assets) grew from $10 trillion to $57 trillion. Over very long periods of time, national wealth is by definition a mean-reversion machine. Over 40 or 50 years, national wealth has to revert to the growth in nominal GDP. That's just the way the economics and the math work out.
Basically, the principle is that trees cannot grow to the sky. Just as total corporate profits cannot grow faster than the overall economy over long periods of time, neither can national wealth. Think of Japan. At one point in 1989, relatively small areas of Tokyo were worth more than the total real estate of California. And then the bubble burst and Japanese national wealth decreased and grew much less than GDP and is now in line with the long-term nominal growth of GDP.
In the US, long-term growth of nominal GDP is about 5.5 percent. We've actually grown by 7.2 percent for the last 25 years. To revert to the mean means that over the next 15 years, maybe more, we're going to see nominal wealth grow between 2.5 and 3 percent. That's a major headwind and a major dislocation from the experience that we've had. Investors have been expecting to get the past 25 years to repeat themselves. The laws of economics suggest that cannot be the case.
We have seen a monster growth in equities in terms of total market cap, even given the flat growth of the last ten years. We all know about the housing market.
I have written extensively about how stock market valuations are mean reverting. We have a long way to go for valuations in terms of Price to Earnings Ratio to get to the mean, and typically (as in almost always) we see P/E ratios drop far below the mean. It is hard to see portfolio increases in such a mean reversion period. We are also watching housing values come down (see more below). What we are going to see is a very difficult period for asset growth in precisely the two areas where investors tend to concentrate their portfolios: US stocks and housing. Using history as our guide, that period could last for another 5-7 years. That is why I keep suggesting you look for alternatives to traditional stock market allocations.
Housing: Are We at the Bottom?
The short answer is no, but let's look at the data from one of the most knowledgeable sources on that topic. John Burns of John Burns Real Estate Consulting consults with over 2000 of the largest banks and homebuilders in the country (his client list is a who's who of banks, builders, and hedge funds). He has a reputation for solid research and pulling no punches. Some of his hedge fund clients were the ones you read about who made billions. (He wishes he had negotiated a percentage!) He is deeply involved in analyzing trends in the housing market. His web site is www.realestateconsulting.com . He has graciously sent me the executive summary of his latest posting (a 27-page executive summary) that we will be looking at for the next few pages.
Let's start with a quote from John at the beginning of his report: "The prospects for the U.S. housing market have changed for the worse. It has become increasingly clear that the U.S. economy is on the brink of recession, as overall job growth has slowed to zero and retailers are reporting abysmal results. New home sales, traffic and pricing are all heading down according to the results of our survey of over 300 builder executives. Resale [existing home] sales are starting to plateau in some markets, but pricing continues to fall as distressed sales dominate the market. The new housing bill will help in some ways, but will first serve a devastating blow to homebuilders, with the elimination of seller-funded down payment assistance, which accounts for 17% of new home demand by one estimate."
How far along are we? Burns thinks that home prices will drop by 22%, 12% of which has already occurred. His analysis differs from that of the Case-Shiller Indices, which suggests a much steeper decline. Note in the graph below that the Case-Shiller Index shows home prices rising more than does Burns' work. Part of it is different methodology and part of it is that the CS index focuses on major markets and Burns' work is more broadly based.
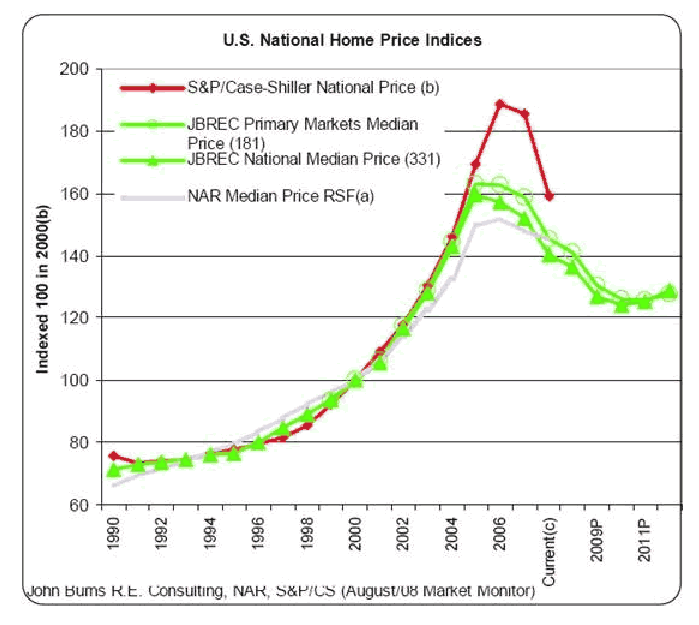
However you slice it, there has been a lot of pain. Shiller's work shows home prices in the areas he measures to be down about 17%. He said last week that he does not think it unlikely that we sill see home prices drop by as much as 30%, or about the same as during the Depression of the '30s. Burns sees less of a drop, but from not as high a point, so they both end up close to the same end point.
The graph above shows Burns' projection for the next few years. He thinks it will be 2011 before housing prices begin to turn back up on a nationwide basis, with national prices continuing to fall into 2010. That will not sit well with the pundits who keep telling us each month that we have seen the bottom.
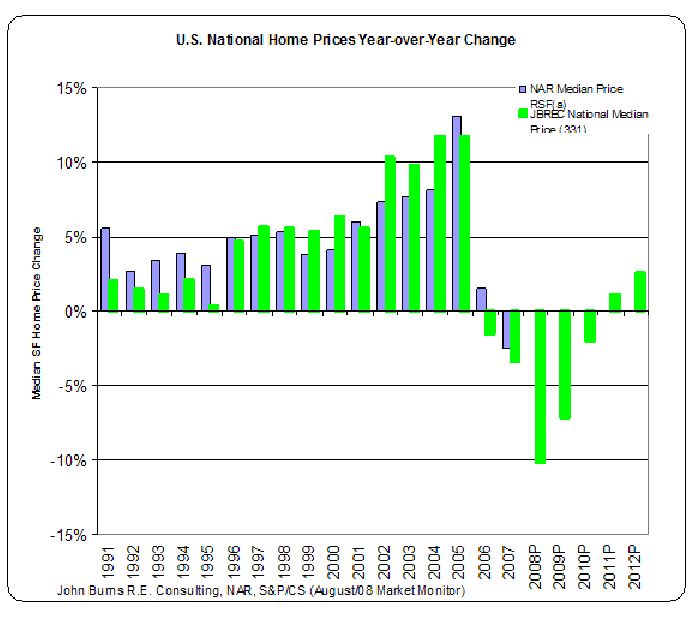
For the difference in his numbers with Case-Shiller, he offers the following explanation: "The Case-Shiller national number, which is a "paired sales" analysis, showed much more price appreciation than other indices based on median prices. We suspect that there was a shift in the mix of homes sold to lower priced homes in 2006 due to subprime lending, which depressed the median value and showed large % increases in the paired sales index."
Sales volumes are suffering. "We believe sales volumes have already fallen back to 1995 levels and will hit 1992 levels sometime next year, when they will begin to slowly rebound later in the year. We are already seeing rebounds in some of the hardest hit markets, such as Southern California, where sales fell to below the levels of the early 1990s. The rebound in sales will be driven by foreclosure buying activity and demand from real households that need to move for personal reasons and have been delaying their purchase for fear of further price corrections. Our 8% per year projected [starting in 2010] increase doesn't get us back to normal sales volumes until after 2012, and that is because the tremendous excesses of this cycle moved many renters into homeownership earlier than usual, and allowed existing homeowners to ‘move up' to their dream home earlier than usual. Conservative mortgage lending will also prevent a sharp turnaround."
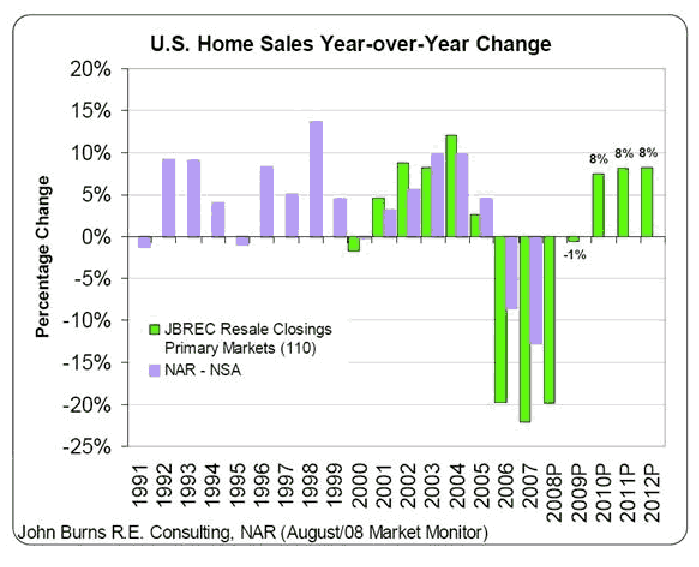
On a more optimistic note, he thinks new home prices, which started to correct much earlier than existing home prices, should bottom out in 2009, although some particularly overbuilt areas will suffer longer. We are actually close to a bottom in new home construction, and he thinks we will be back to 900,000 new homes by 2012. That is a far cry from the 1.68 million in 2005, but it is also a sustainable number.
There is a problem though, and that is the recently enacted housing bill eliminated seller-funded down payments, and this was 17% of new home sales. Watch for a rise in the number of new homes sold in September, as the new law does not take effect until October. Home builders will be telling people to buy now before this ability to help with the down payment goes away. But cheerleaders on TV will be telling us the market has turned. They won't be saying that in November.
Alt-A is the New Subprime
By now, everyone in the world is aware of how bad the subprime mortgage business was. But now it is time to get ready to hear the same tale, told again, about Alt-A mortgages. These are mortgages made to borrowers with better credit scores than subprime borrowers, but who could not or decided not to document their income. One estimate is that 70% of Alt-A borrowers may have exaggerated their incomes (Wholesale Access). More than half of those were people who exaggerated their incomes by 50% or more! (Mortgage Asset Research Institute)
How much are we talking about? Around 3 million US borrowers have Alt-A mortgages totaling $1 trillion, compared with $855 billion of subprime loans outstanding. $400 billion of that was sold in 2006. Almost 16% of securitized Alt-A loans issued since January 2006 are at least 60 days late. Many of these loans (around $270 billion) were interest-only or with a low teaser rate, and the resets were at 3- and 5-year lengths. These are called Option ARMs. That means starting next year we are going to see a wave of mortgages resetting to new rates. And it is no modest increase. Rates can jump 4-8% or more from teaser rates. Some Option ARMs are resetting at 12.25%. That can double a payment.
Wachovia and Washington Mutual were big sellers of Alt-A loans, and had $122 billion and $53 billion, respectively, on their books at the end of the second quarter. Is it any wonder their stocks are under pressure? That is why it is so hard to quantify how many more write-offs there will be. You don't write down a mortgage until it starts to develop problems. These problems may not show up for a few years. I continue to stress I do not want to own a financial stock that has exposure to mortgage paper. Write-downs are going to continue to come for a long time.
This means there will be a steady wave of foreclosures for the next two years in communities all over the US. As long as these homes keep coming onto the market, they are going to exert downward pressure on prices. Foreclosure sales are up by 109 from this time last year.
3.5 Million Unemployed and Counting
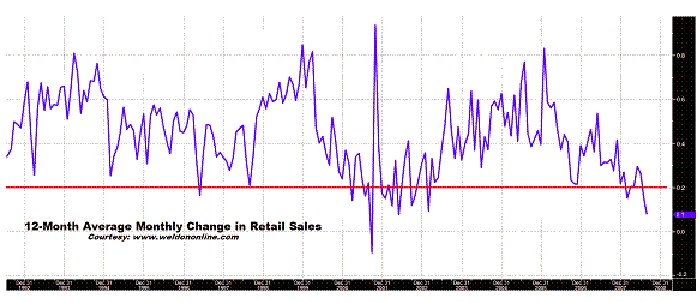
The number of people receiving unemployment benefits jumped to 3.525 million, the highest level since 2003. My friend, Chief Economist John Silvia at Wachovia forecasts that unemployment will rise to 6.7% in 2009 (from 5.5% today) and above 7% in 2010. Given the inability of US consumers to borrow against their homes, and with rising unemployment, is it any wonder that consumer spending data released this morning showed retail sales dropping 0.3% in August, for the second month in a row (July was down 0.5%)? Excluding automobiles, sales dropped 0.7% in August, the most this year.
Look at this chart from Greg Weldon ( www.weldononline.com ). As he notes, retail sales are posting their worst reading since the last recession.
Prices at the wholesale level actually fell. Silvia thinks the Consumer Price Index will be in the neighborhood of 2%. Right now, a lot of people think that sounds crazy; but I agree. First, remember that CPI measures changes over the last 12 months. As an example, look at the oil price chart below. Starting next spring, unless energy prices rise a lot, we are going to see year-over-year comparisons for energy prices that will be negative. If oil drops to $80, which it very well could, that would have the affect of decreasing inflation next summer, by a significant amount. And given that Europe and Japan are in a recession, and emerging markets have reduced demand because of high prices, thinking that oil in the short term could be lower is not unreasonable. (Long-term I think oil will go MUCH higher, but that is another story.) A 40% reduction in gas prices from their peak is not out of the question. That would impact inflation by pulling it down.
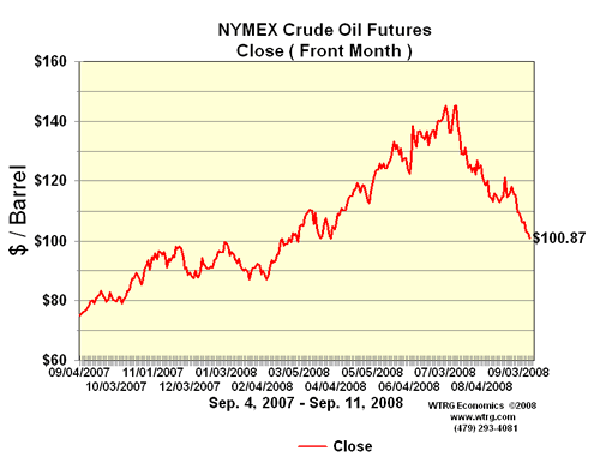
You can make the same case for a lot of commodities and some of the food complex as well. Year-over-year comparisons are going to start to look good in a few quarters. In absolute terms, looking back a few years, it will still feel like inflation, but the numbers don't have feelings.
With Europe and Great Britain central banks likely to cut rates, the dollar is going to get stronger (as predicted here long ago). That will also help hold inflation down. Consumer spending is going to continue to be under pressure, which will not be good for stocks, which means that those facing retirement are going to have to save more and spend less. I think this time next year we will start to see stories about deflation. I know, call me crazy, but given that we have seen two major bubbles burst in the last year (housing and credit), it is not out of the realm of reason. It is what SHOULD happen. Bursting bubbles are by definition deflationary events.
Within a few quarters the Fed will not be under pressure to raise rates, especially with rising unemployment and what is clearly an economy on the ropes. Further, banks need lower rates in order to re-liquify. Home buyers will need lower rates as well. I think, as I have written for a long time, that the Fed is on hold for a very long time. And I am not sanguine that the next move will be a rate hike. This time next year when inflation is seen as yesterday's problem and unemployment is rising, the drums may be pounding for a rate cut. We live in interesting times.
La Jolla, South Africa, and London
Next Monday Tiffani and I get on a plane, assuming the hurricane is out of town by then, and fly to La Jolla to be with Jon Sundt and the team at my US partner, Altegris Investments, coming back Tuesday. Then next Friday Chuck Butler from Everbank, Thomas Fischer from Jyske Bank, and a crew from the Sovereign Wealth Society are going to show up at my office to watch a Texas Rangers game. Chuck is a huge baseball fan and he is always fun to be around.
Then Saturday morning I fly to South Africa for a speech the next Tuesday. I will be speaking at the ABSIP (Association for Black Securities & Investment Professionals) Annual Conference in Cape Town on September 23. To obtain more information, contact my South African partner, Prieur du Plessis, through the contact facility on the Investment Postcards from Cape Town blog.
That night I fly to London and spend the day there with my friend Niels Jensen and his team at my London partners, Absolute Return Partners. We will be meeting with clients, and I have some time available there. Contact me and I will put you in touch with them.
There are a lot of things happening in the alternative investment world, and I try and stay on top of them. If you are interested in looking at hedge funds, commodity funds, and other alternative funds, go to www.accreditedinvestor.ws and sign up, and I will have one of my partners contact you and show you what is "behind curtain #3". (I am president and a registered representative of Millennium Wave Securities, LLC., member FINRA.)
My travel and writing schedule is pretty rough right now. When I get back I have a trip to Europe in mid-October (Sweden, Malta, London, maybe the Mideast) and then I am coming home for a while to catch up and finish the book with Tiffani and try to get my own book, way past due, finished as well.
I am going to hit the send button a little early so I can make sure everything is ready for Ike to show up tomorrow. We are 250 miles inland (Dallas), but they are expecting some bad weather, and the real problem here will be that the conditions will be perfect for tornadoes. It should be an interesting weekend. Right now the weather is perfect, but in 24 hours it will be very wet. The real problems will be in Houston and Galveston. I wish my fellow Texans well.
I see some time to stay home and read science fiction in my near future. Enjoy your weekend, wherever you are.
Your hoping it does not get that bad analyst,
By John Mauldin
John Mauldin, Best-Selling author and recognized financial expert, is also editor of the free Thoughts From the Frontline that goes to over 1 million readers each week. For more information on John or his FREE weekly economic letter go to: http://www.frontlinethoughts.com/learnmore
To subscribe to John Mauldin's E-Letter please click here:http://www.frontlinethoughts.com/subscribe.asp
Copyright 2008 John Mauldin. All Rights Reserved
John Mauldin is president of Millennium Wave Advisors, LLC, a registered investment advisor. All material presented herein is believed to be reliable but we cannot attest to its accuracy. Investment recommendations may change and readers are urged to check with their investment counselors before making any investment decisions. Opinions expressed in these reports may change without prior notice. John Mauldin and/or the staff at Millennium Wave Advisors, LLC may or may not have investments in any funds cited above. Mauldin can be reached at 800-829-7273.
Disclaimer PAST RESULTS ARE NOT INDICATIVE OF FUTURE RESULTS. THERE IS RISK OF LOSS AS WELL AS THE OPPORTUNITY FOR GAIN WHEN INVESTING IN MANAGED FUNDS. WHEN CONSIDERING ALTERNATIVE INVESTMENTS, INCLUDING HEDGE FUNDS, YOU SHOULD CONSIDER VARIOUS RISKS INCLUDING THE FACT THAT SOME PRODUCTS: OFTEN ENGAGE IN LEVERAGING AND OTHER SPECULATIVE INVESTMENT PRACTICES THAT MAY INCREASE THE RISK OF INVESTMENT LOSS, CAN BE ILLIQUID, ARE NOT REQUIRED TO PROVIDE PERIODIC PRICING OR VALUATION INFORMATION TO INVESTORS, MAY INVOLVE COMPLEX TAX STRUCTURES AND DELAYS IN DISTRIBUTING IMPORTANT TAX INFORMATION, ARE NOT SUBJECT TO THE SAME REGULATORY REQUIREMENTS AS MUTUAL FUNDS, OFTEN CHARGE HIGH FEES, AND IN MANY CASES THE UNDERLYING INVESTMENTS ARE NOT TRANSPARENT AND ARE KNOWN ONLY TO THE INVESTMENT MANAGER.
John Mauldin Archive |
© 2005-2022 http://www.MarketOracle.co.uk - The Market Oracle is a FREE Daily Financial Markets Analysis & Forecasting online publication.


