


Study: What Happens Next to Stocks When the Put/Call Ratio is Very Low
Forecasts / Stock Markets 2018 Jun 11, 2018 - 12:37 PM GMTBy: Troy_Bombardia

The Equity-Only Put/Call Ratio was very low last Tuesday, falling below 0.5 for the first time since January 2018. This is commonly seen as a bearish sign. It isn’t. Here’s the data to prove it.
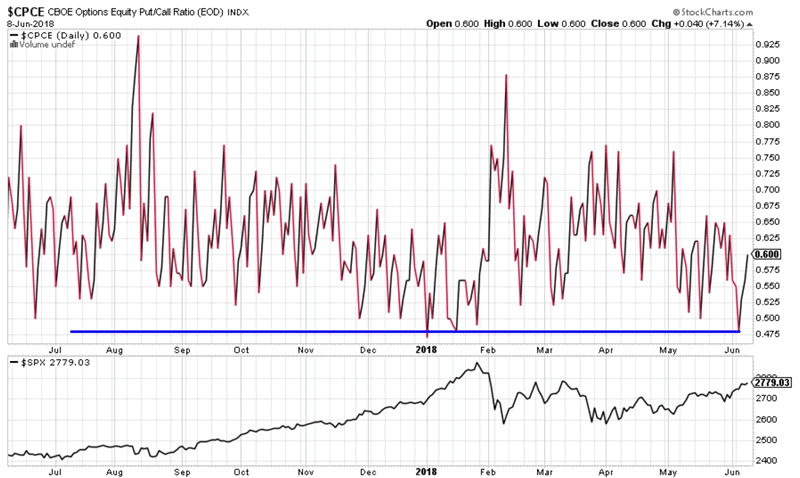
When the Put/Call Ratio becomes this low for the first time in 4 months, it is actually a short and medium term bullish sign for the stock market.

Click here to download the data in Excel.
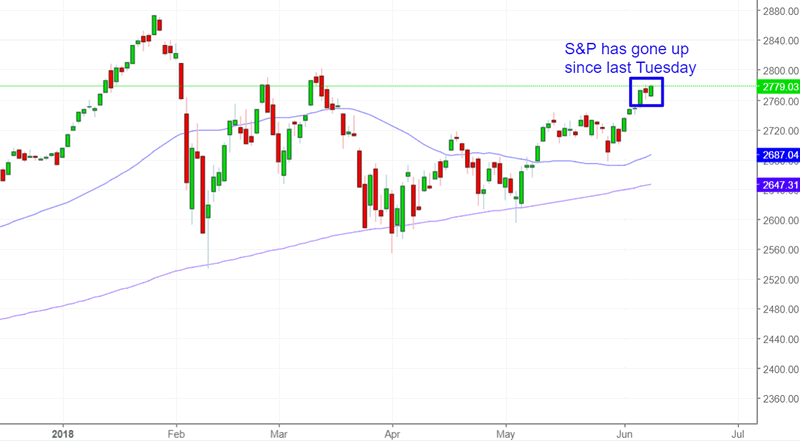
Keep in mind that this study is as of last Tuesday. Historically, the stock market went up 90% of the time on a 2 weeks forward basis. And so far it has – the stock market is up since last Tuesday.
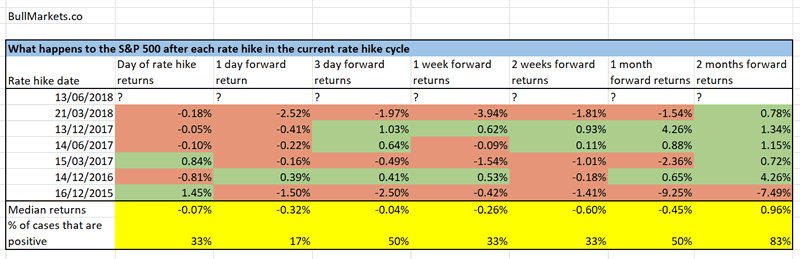
So how does this square with the short term bearish studies we presented yesterday?
The stock market tends to fall a little 1-2 weeks after a rate hike (to be expected this Wednesday).
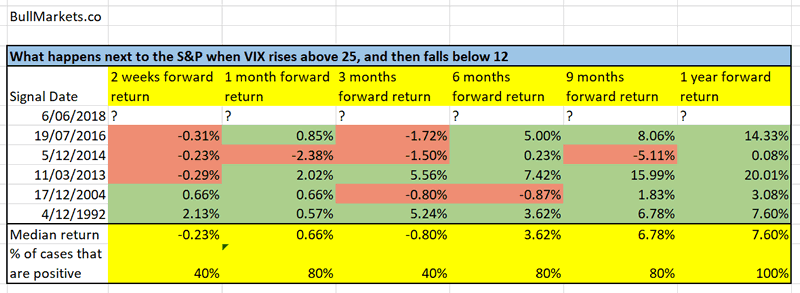
VIX has fallen to 12. A 2 week decline in the S&P would not be unexpected:
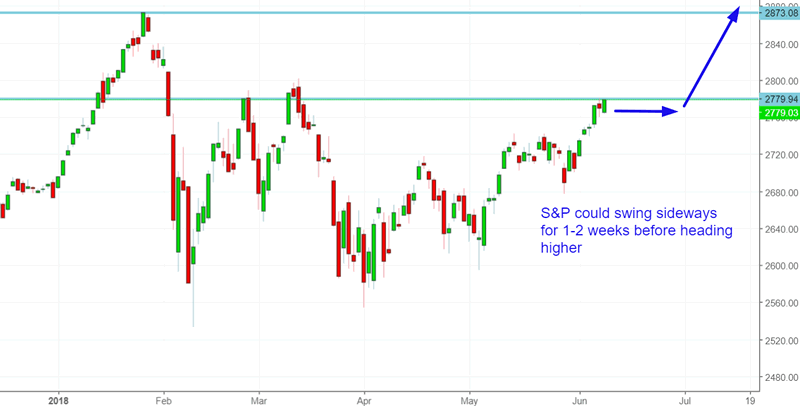
I previously thought that the stock market would probably make a small 1-2 week pullback before heading higher in the medium term. I’m slightly revising that outlook.
Instead, I think that the S&P 500 will probably swing sideways below its current resistance for a week or 2 before heading higher. Remember, “short term weakness” doesn’t mean that the stock market has to make a sizable pullback. A sideways consolidation counts as “short term weakness” too.
But going back to the Put/Call Ratio study, we can see that this is also a medium term bullish sign for the stock market. When the Put/Call Ratio becomes this low for the first time in 4 months, it’s a sign that the stock market’s bullish momentum has returned.
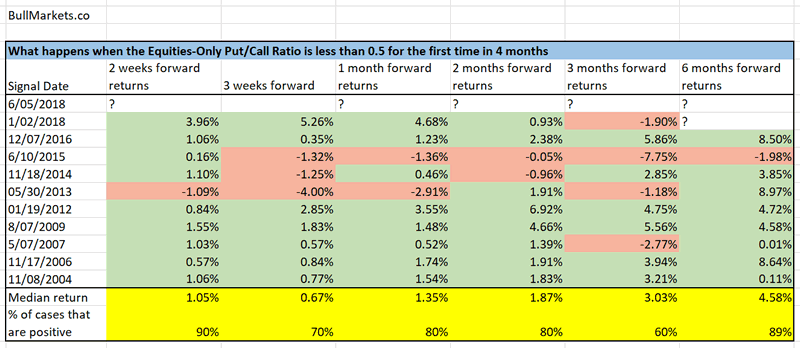
Look at the S&P 500’s returns on a 2 months and 6 months forward basis.
Click here for more market studies.
By Troy Bombardia
I’m Troy Bombardia, the author behind BullMarkets.co. I used to run a hedge fund, but closed it due to a major health scare. I am now enjoying life and simply investing/trading my own account. I focus on long term performance and ignore short term performance.
Copyright 2018 © Troy Bombardia - All Rights Reserved
Disclaimer: The above is a matter of opinion provided for general information purposes only and is not intended as investment advice. Information and analysis above are derived from sources and utilising methods believed to be reliable, but we cannot accept responsibility for any losses you may incur as a result of this analysis. Individuals should consult with their personal financial advisors.
© 2005-2022 http://www.MarketOracle.co.uk - The Market Oracle is a FREE Daily Financial Markets Analysis & Forecasting online publication.