NASDAQ Leading the S&P is a Bullish Sign
Stock-Markets / Stocks Bull Market Jun 04, 2018 - 02:22 PM GMTBy: Troy_Bombardia
 The NASDAQ and S&P are both up this year from January – May. However, the NASDAQ has massively outperformed the S&P by more than 6%.
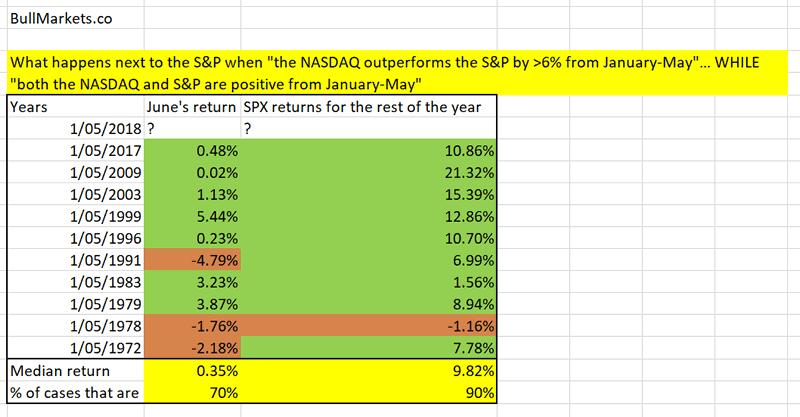
Here are all the historical cases in which the NASDAQ outperformed the S&P by more than 6% from January-May (while both indexes are positive), and what happens next to the S&P for the rest of the year.
Click here to download the data in Excel.
Here are the historical cases in detail.
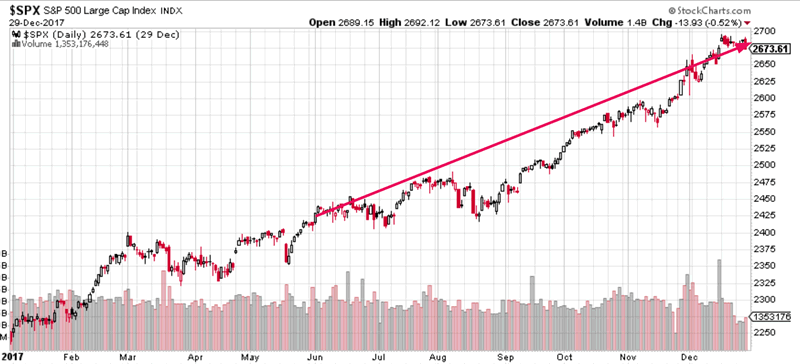
2017
The S&P trended higher throughout the rest of the year.
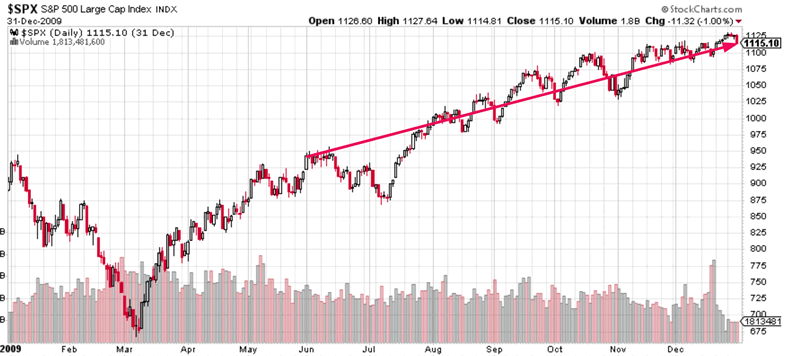
2009
The S&P trended higher throughout the rest of the year.
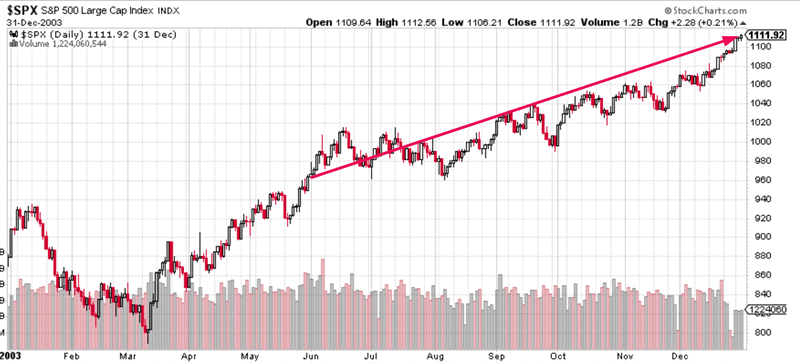
2003
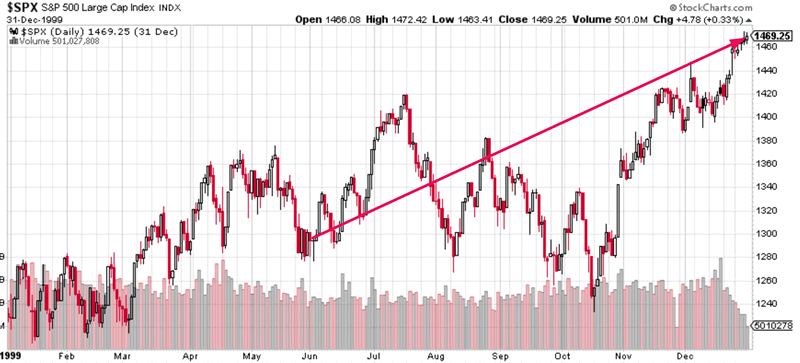
1999
The S&P trended higher throughout the rest of the year, although it did so in a choppy manner.
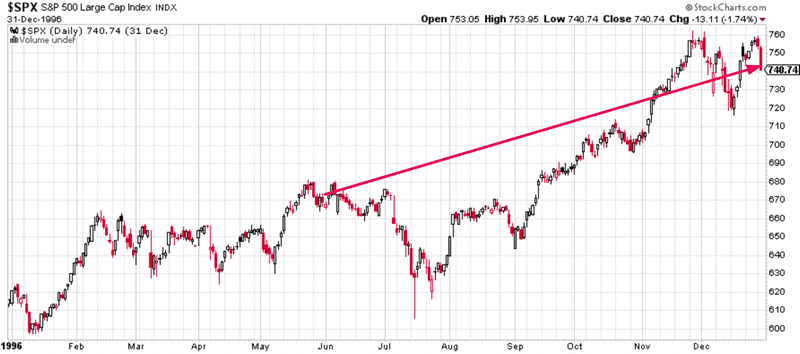
1996
The S&P trended higher throughout the rest of the year, although it did so in a choppy manner.
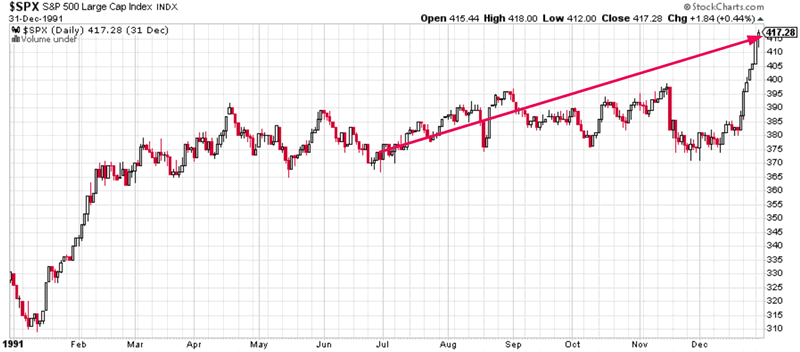
1991
The S&P trended higher throughout the rest of the year, although it did so in a choppy manner.
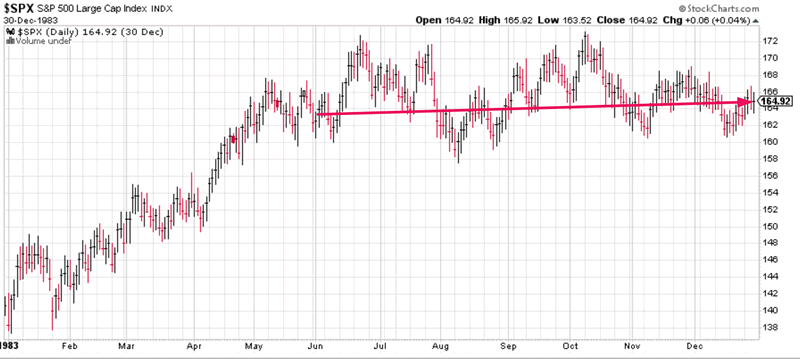
1983
The S&P trended sideways throughout the rest of the year.
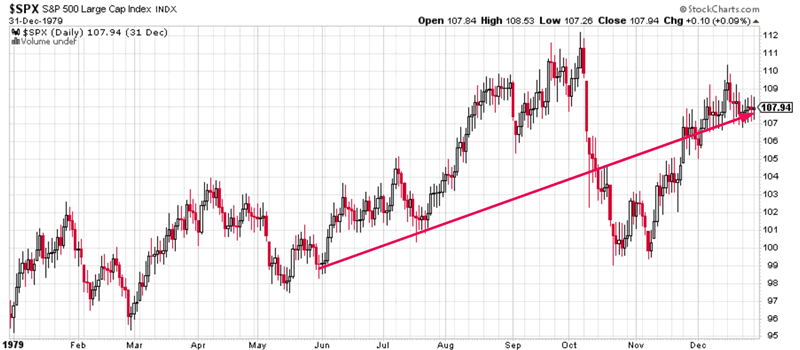
1979
The S&P trended higher throughout the rest of the year, although it did so in a choppy manner.
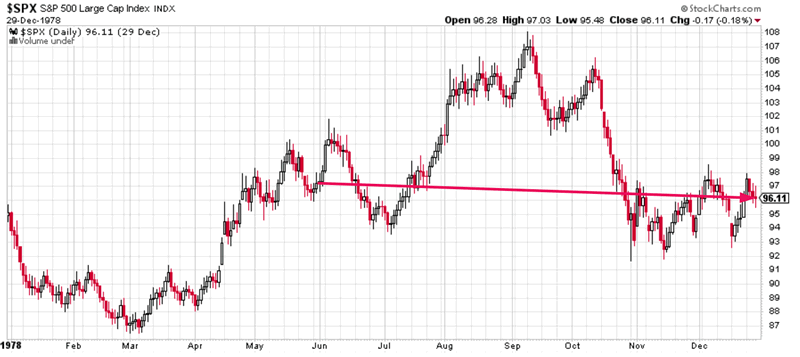
1978
The S&P trended sideways throughout the rest of the year.
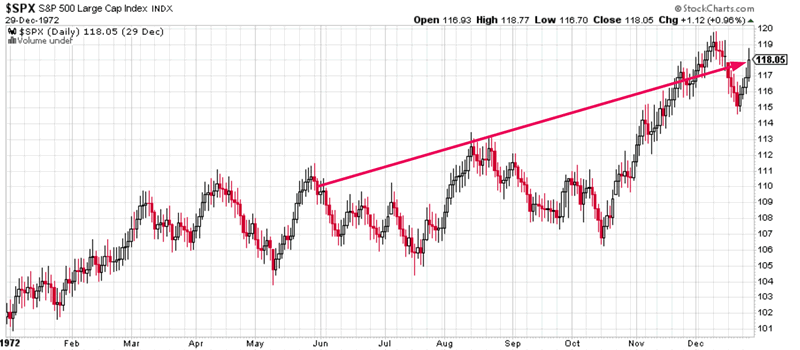
1972
The S&P trended higher throughout the rest of the year, although it did so in a choppy manner.
Conclusion
This is a medium term bullish sign for the stock market. It suggests that the stock market will trend higher throughout the rest of the year, even though it may do so in a choppy manner.
There was only 1 loss at year end out of the 10 historical cases. This was a tiny loss: -1.16%
Click here for more market studies
By Troy Bombardia
I’m Troy Bombardia, the author behind BullMarkets.co. I used to run a hedge fund, but closed it due to a major health scare. I am now enjoying life and simply investing/trading my own account. I focus on long term performance and ignore short term performance.
Copyright 2018 © Troy Bombardia - All Rights Reserved
Disclaimer: The above is a matter of opinion provided for general information purposes only and is not intended as investment advice. Information and analysis above are derived from sources and utilising methods believed to be reliable, but we cannot accept responsibility for any losses you may incur as a result of this analysis. Individuals should consult with their personal financial advisors.
© 2005-2022 http://www.MarketOracle.co.uk - The Market Oracle is a FREE Daily Financial Markets Analysis & Forecasting online publication.


