


Did the Crypto Market Just Bottom?
Currencies / BlockChain May 30, 2018 - 02:03 PM GMTBy: Ryan_Wilday

 In my recent article, "Time for a Crypto Lunar Rocket Launch?" I stated that we have been tracking bullish 5-wave patterns off the April lows, and viewed most cryptocurrencies in wave-2 corrections or about to complete the impulse and enter wave 2s. However, some disparate coins are currently in B waves or wave iv corrections.
I also stated that some of the corrective fractals that we were beginning to see were shallow, particularly that in Ethereum. Meanwhile, I said that corrective waves are notorious for twists and turns, and for changing the views of traders and analysts alike. So, I always ground myself in a zoomed-out point of view.
By that view, we went deep — deeper than we prefer — on a few of the coins we track, but have so far stayed well above April lows in most. Yet, most coins we track are well within ideal range for a wave-2 bottom that will set us up for much higher.
I want to focus on the opportunities in Bitcoin and Ethereum, leading bellwethers for the crypto market that — at the time of writing — are quite shallow even after a horrific, impulsive drop this morning (May 24). But before I get to charts, let’s discuss sentiment.
Wave 2s are the life blood of the Elliott Wave trader, as this is the wave that washes sentiment out and sets up the third wave — which is usually the most extended wave, and often the fastest.
Paraphrasing R. N. Elliott in the 1930s, the wave-2 correction fools the crowd into believing the bear market has returned. In the case of cryptos, the “bear market” is the correction that started in late December to early January, and continued at least until the April lows.
I can say that sentiment gave us a hint that we were reaching bearish crescendo. From Twitter “whining” to those reminding everyone the bubble popped — and from stories of larger traders selling their positions to the high-volume selling we have seen between 11:30 a.m. and 1:00 p.m. EST on May 23 — it seems that crypto traders have been bloodletting.
This is the normal course for an Elliott Wave trader, focused on waves of sentiment that are reflected in mathematical price patterns. But how do we know when this bearishness has reached its limit, exhausted its fury, and given room for bulls to re-enter? First, we need to see price not push through key support.
For Ethereum, that ideal level is $495, with $430 the lowest I allow. We are still slightly shallow in Ethereum. Bitcoin ideally held $7,624 and we have a small breach. But as long as it is over $7,085, I will give this room to start a third wave.
Note there is a triangle pattern on the daily Bitcoin chart that give room into the high $6000's.
See 6-hour charts of Ethereum and Bitcoin
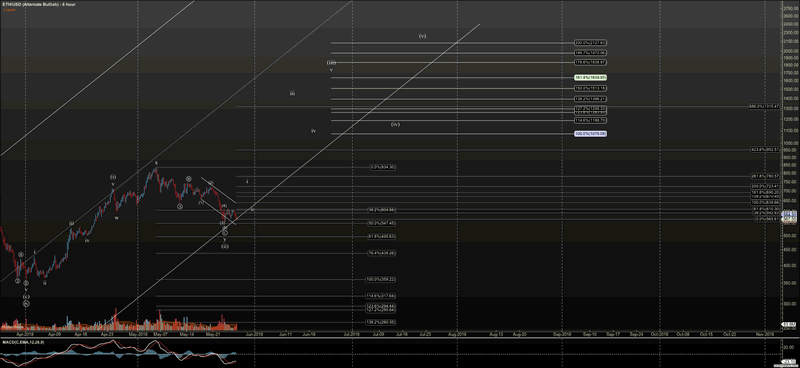
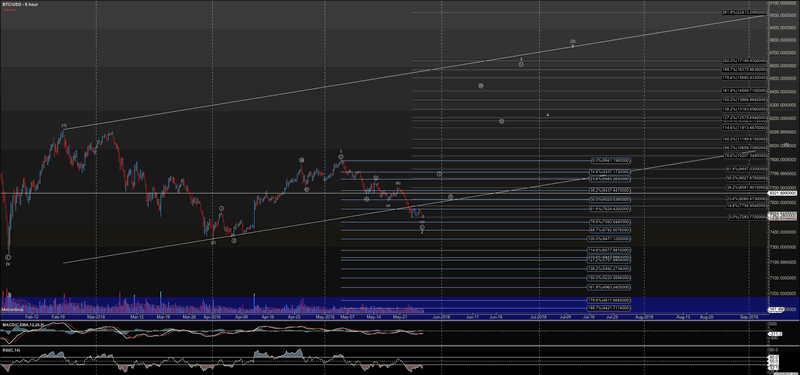
Next, we need to see a 5-wave move, and the probability of a bottom being in rises if prices retrace .618 of the correction. Key levels to the upside are $719 in Ethereum and $8,910 in Bitcoin. In that regard, we have work to do. But I am, as of writing, tracking a potential nano 5-wave move in both.
In the charts, these labels reflect a 5-wave pattern off these lows, which I would like to see before I can call this a bottom. Then, I would expect small retraces to set up our larger, expected third wave, which targets north of $1,800 in Ethereum and $15,000 in Bitcoin — and beyond, if there is a larger degree follow-through.
See 5- and 15-minute charts of Ethereum and Bitcoin.
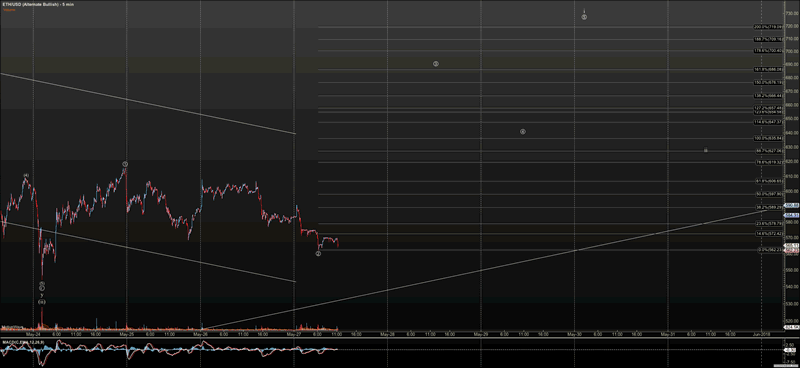
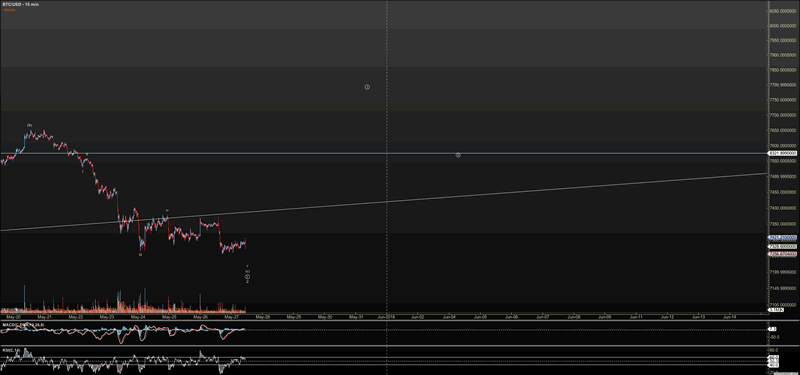
Ethereum is currently holding a setup for higher at $560, while Bitcoin appears it needs to make more ‘nano wave’ lower. Yet Bitcoin is holding the larger degree support region.
In short, we have the first condition met for an important trade set-up and lasting bottom, mentioned in my article on May 10 — a deep-enough correction to wash out sentiment and stoke weak hands to sell. Now, we need to see bulls take control, and witness this in impulsive price action that takes out resistance.
And, as always markets will do what they do. If these fresh impulses break down and support eventually gives way, we must look down — even to a break below April lows, and a protracted correction. Clearly, this is an important point in time.
See the charts provided in this article in an expandable format.
Ryan Wilday is a cryptocurrency analyst at ElliottWaveTrader, where he hosts the Cryptocurrency Trading premium subscription service.
© 2018 Copyright Ryan Wilday - All Rights Reserved Disclaimer: The above is a matter of opinion provided for general information purposes only and is not intended as investment advice. Information and analysis above are derived from sources and utilising methods believed to be reliable, but we cannot accept responsibility for any losses you may incur as a result of this analysis. Individuals should consult with their personal financial advisors
© 2005-2022 http://www.MarketOracle.co.uk - The Market Oracle is a FREE Daily Financial Markets Analysis & Forecasting online publication.