


Prepared For The Next Leg In The US Stock Markets?
Stock-Markets / Stock Markets 2018 May 29, 2018 - 10:18 AM GMTBy: Dan_Steinbock

 Ever since the deep price rotation in late January/early February 2018, many analysts have attempted to pinpoint the next moves in the markets. We recall reading the “doom and gloom” reports telling traders this is the big one and to prepare for a much lower price breakdown. We also read a few research posts that aligned with our adaptive predictive modeling systems suggesting this move would expand into extended bottoming rotation. We want to point out a few components of this move that most analysts are missing.
As we continue through this article, we want to highlight the similarities of this recent price rotation to the price rotation that took place in 2015/2016 and how prices advanced in staged “legging” patterns that allowed a great opportunity for traders and investors.
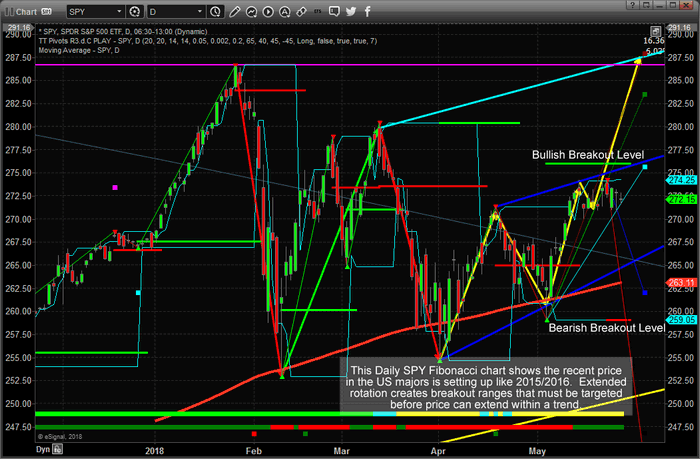
Take a look at this first chart below of the recent SPY price rotation on a Daily basis. It shows the late January price peak and the deep price low that established this range of rotation. This chart also shows our adaptive Fibonacci price modeling system and the analysis results of this strategy. You should be able to see the RED and GREEN horizontal levels that are drawn on this chart widening against price levels. This is indicative of non-trending price rotation as our adaptive Fibonacci modeling system sees this price rotation as “attempting to establish a new breakout trend”.
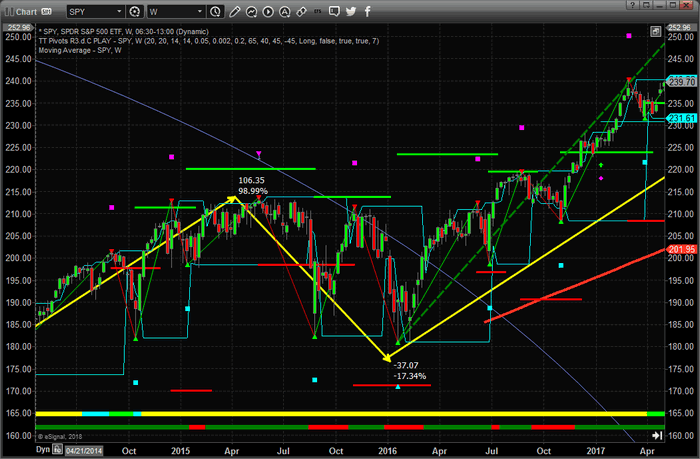
Now, please compare the SPY Daily chart (above) to the Weekly SPY chart from 2015~2016 (below) and pay attention to the price rotation between July 2015 and last 2016. The initial price breakdown in August/September 2015 was rather deep and established a price low near $182.50. After the initial price breakdown, price rallied back to near the previous highs before stalling again and falling to new lows before recovering. This move is very similar to the current price rotation – two very deep price corrections with wide range peaks and troughs. What happened next?
Take another look at the chart, below, and pay attention to the upward price move after January 2016. Notice that the upward price move started to build some upside momentum – establishing new higher low points and, eventually, breaking out to new price highs near August/September 2016? Take a real close look at this move and compare it to the first chart. Although these two charts are not exactly the same, our Fibonacci price modeling system, in both instances, developed similar types of Fibonacci target levels and analysis. The result of the current chart, above, is that we have yet to see a substantial upside price move that would prompt the Fibonacci price modeling system to bias the upside trend into its analysis – but we are close to this happening (very close).
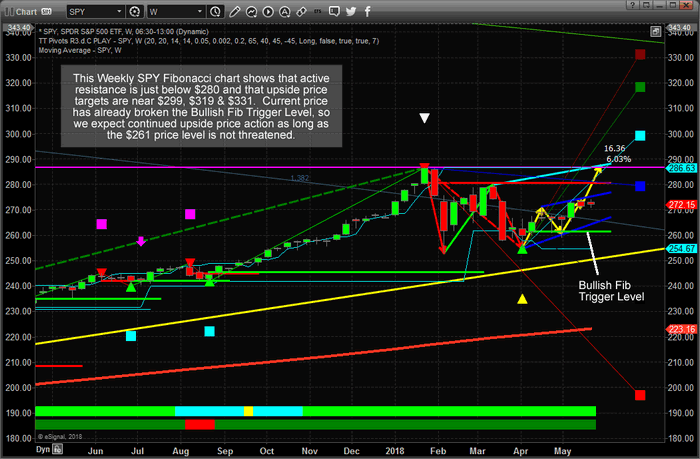
Now, lets take a look at the current Weekly SPY chart that shows how narrow and short this current price rotation really is in comparison to the 2015/2016 rotation. Currently, the entire price rotation that we are discussing has consisted for only four months – whereas the 2015/2016 price rotation consisted of almost 12 to 14 months total (before new price highs were established). If the current price rotation continues at this pace, already having established two critical lows and beginning the upside price leg (in 4 months) that took the previous 2015/2016 rotation over 8 months to complete, we could expect a fairly dramatic upside price move in the US majors within the next 30+ days that could equate to the last 4 to 5 months upside activity within the 2015/2016 rotation. In other words, this entire move is mirroring the 2015/2016 price rotation as a speed that is nearly 3x the earlier rotation.
Now, focus on one thing right now, the current Weekly SPY chart, below, is showing a Bullish Fibonacci price trigger level that has already been breached (near early April 2018). This key component that is different from the earlier price rotation is a very clear indication that we could see a big move to the upside in the US equities market at a much faster rate than compared to what happened in 2015/2016.
The last chart we want to share with you is this Daily YM chart with our Fibonacci modeling system at work. The recent price rotation near the right side of this chart has clearly illustrated the Fibonacci Price Trigger Levels and shown us that the upper Price Trigger level has already been broken while the lower Price Trigger levels have acted as a support boundary for price. One thing to understand about this Fibonacci price modeling system and the Price Trigger Levels is that they are like key targets for price. If price “crosses” the Fibonacci Price Trigger Levels, then this price level and trend direction becomes ACTIVE. If not, they act as “boundaries” for price often becoming support or resistance level in the future.
Based on our research and analysis, the bias for the markets is, and has continued to be, bullish. We are expecting a moderately large upside breakout to happen within the next 5~15 days that may drive prices to near or above all-time highs in the US majors. We don’t expect you to understand or to be able to read our advanced Fibonacci modeling system like we can. We’ve been working with this system for many years and this might be your first time viewing these types of charts. What we want to push into your thinking is that our modeling systems are suggesting a broad market upside breakout is very likely over the next few weeks and months. As long as key support levels are not breached and the current trend BIAS does not change, our analysis is to get ready for a potentially large upside price move.
If you’ve made it to the end of this article and understand the value of our work researching, coding and developing this content for you to better understand the future of the markets, then we thank you very much for your dedication and focus in reaching this point. We also urge you to support our efforts in providing you this type of advanced and proprietary research and modeling tools by visiting www.TheTechnicalTraders.com to learn more about how we can help you find and execute success each week in the markets. Our job is to be your research team, provide you with detailed analysis (both video based and text based) and to provide you with detailed trading signals that are primed for profits. We take pride in our ability to deliver the best and most innovative market research you’ll find anywhere and our clients love the exclusive member only content and trades. Please take a moment to see how we can help you achieve greater success.
Our 53 years experience in researching and trading makes analyzing the complex and ever-changing financial markets a natural process. We have a simple and highly effective way to provide our customers with the most convenient, accurate, and timely market forecasts available today. Our stock and ETF trading alerts are readily available through our exclusive membership service via email and SMS text. Our newsletter, Technical Trading Mastery book, and 3 Hour Trading Video Course are designed for both traders and investors. Also, some of our strategies have been fully automated for the ultimate trading experience.
Chris Vermeulen
www.TheTechnicalTraders.com
Chris Vermeulen has been involved in the markets since 1997 and is the founder of Technical Traders Ltd. He is an internationally recognized technical analyst, trader, and is the author of the book: 7 Steps to Win With Logic
Through years of research, trading and helping individual traders around the world. He learned that many traders have great trading ideas, but they lack one thing, they struggle to execute trades in a systematic way for consistent results. Chris helps educate traders with a three-hour video course that can change your trading results for the better.
His mission is to help his clients boost their trading performance while reducing market exposure and portfolio volatility.
He is a regular speaker on HoweStreet.com, and the FinancialSurvivorNetwork radio shows. Chris was also featured on the cover of AmalgaTrader Magazine, and contributes articles to several leading financial hubs like MarketOracle.co.uk
Disclaimer: Nothing in this report should be construed as a solicitation to buy or sell any securities mentioned. Technical Traders Ltd., its owners and the author of this report are not registered broker-dealers or financial advisors. Before investing in any securities, you should consult with your financial advisor and a registered broker-dealer. Never make an investment based solely on what you read in an online or printed report, including this report, especially if the investment involves a small, thinly-traded company that isn’t well known. Technical Traders Ltd. and the author of this report has been paid by Cardiff Energy Corp. In addition, the author owns shares of Cardiff Energy Corp. and would also benefit from volume and price appreciation of its stock. The information provided here within should not be construed as a financial analysis but rather as an advertisement. The author’s views and opinions regarding the companies featured in reports are his own views and are based on information that he has researched independently and has received, which the author assumes to be reliable. Technical Traders Ltd. and the author of this report do not guarantee the accuracy, completeness, or usefulness of any content of this report, nor its fitness for any particular purpose. Lastly, the author does not guarantee that any of the companies mentioned in the reports will perform as expected, and any comparisons made to other companies may not be valid or come into effect.
Chris Vermeulen Archive |
© 2005-2022 http://www.MarketOracle.co.uk - The Market Oracle is a FREE Daily Financial Markets Analysis & Forecasting online publication.