Most Popular
1. It’s a New Macro, the Gold Market Knows It, But Dead Men Walking Do Not (yet)- Gary_Tanashian
2.Stock Market Presidential Election Cycle Seasonal Trend Analysis - Nadeem_Walayat
3. Bitcoin S&P Pattern - Nadeem_Walayat
4.Nvidia Blow Off Top - Flying High like the Phoenix too Close to the Sun - Nadeem_Walayat
4.U.S. financial market’s “Weimar phase” impact to your fiat and digital assets - Raymond_Matison
5. How to Profit from the Global Warming ClImate Change Mega Death Trend - Part1 - Nadeem_Walayat
7.Bitcoin Gravy Train Trend Forecast 2024 - - Nadeem_Walayat
8.The Bond Trade and Interest Rates - Nadeem_Walayat
9.It’s Easy to Scream Stocks Bubble! - Stephen_McBride
10.Fed’s Next Intertest Rate Move might not align with popular consensus - Richard_Mills
Last 7 days
Stocks, Bitcoin, Gold and Silver Markets Brief - 18th Feb 25
Harnessing Market Insights to Drive Financial Success - 18th Feb 25
Stock Market Bubble 2025 - 11th Feb 25
Fed Interest Rate Cut Probability - 11th Feb 25
Global Liquidity Prepares to Fire Bull Market Booster Rockets - 11th Feb 25
Stock Market Sentiment Speaks: A Long-Term Bear Market Is Simply Impossible Today - 11th Feb 25
A Stock Market Chart That’s Out of This World - 11th Feb 25
These Are The Banks The Fed Believes Will Fail - 11th Feb 25
S&P 500: Dangerous Fragility Near Record High - 11th Feb 25
Stocks, Bitcoin and Crypto Markets Get High on Donald Trump Pump - 10th Feb 25
Bitcoin Break Out, MSTR Rocket to the Moon! AI Tech Stocks Earnings Season - 10th Feb 25
Liquidity and Inflation - 10th Feb 25
Gold Stocks Valuation Anomaly - 10th Feb 25
Stocks, Bitcoin and Crypto's Under President Donald Pump - 8th Feb 25
Transition to a New Global Monetary System - 8th Feb 25
Betting On Outliers: Yuri Milner and the Art of the Power Law - 8th Feb 25
President Black Swan Slithers into the Year of the Snake, Chaos Rules! - 2nd Feb 25
Trump's Squid Game America, a Year of Black Swans and Bull Market Pumps - 24th Jan 25
Japan Interest Rate Hike - Black Swan Panic Event Incoming? - 23rd Jan 25
It's Five Nights at Freddy's Again! - 12th Jan 25
Squid Game Stock Market 2025 - 5th Jan 25

Market Oracle FREE Newsletter

How to Protect your Wealth by Investing in AI Tech Stocks

Crude Oil $200 a Barrel, What happened?

Commodities / Crude Oil Sep 12, 2008 - 06:22 AM GMT

By: INO

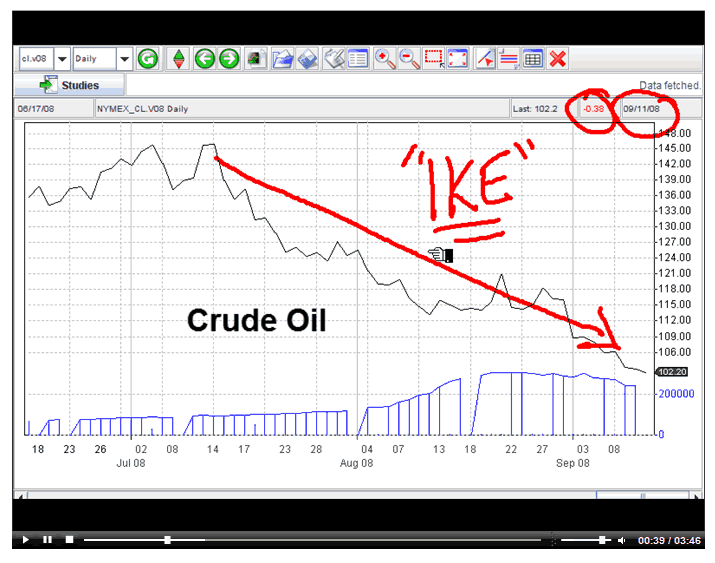
Commodities Best Financial Markets Analysis ArticleIt's true, the rumors were circulating heavily when crude oil was trading at $145 a barrel that it was going to be hitting $200 a barrel in a matter of days or weeks at the very latest. Well, that never happened. Crude oil learned that gravity plays a part in every commodity market's life.


The pullback in crude oil, given the fact that a major hurricane named Ike is shooting for the gulf, is not so surprising given the history of the commodity markets. Often times we see pressure coming into a market months ahead of the actual news that either production has been increased or demand fluctuation has changed the dynamics of the marketplace.

Take a few minutes and watch this video and see how we have been looking at crude oil. Afterwards, check out our track record in this market for the past 12 months.

I hope you find time to quickly browse through this video as it will certainly give you some good trading tips on how to improve your own trading.

Every success in the markets and in life,

Adam Hewison
President, INO.com
Co-Creator of MarketClub

By INO.com

INO and Quote Providers furnish quotes and market analysis without responsibility for accuracy and is accepted by the site visitor on the condition that transmission or omissions shall not be made the basis for any claim, demand or cause for action. The information and data was obtained from sources believed to be reliable, but we do not guarantee its accuracy. Neither the information, nor any opinion expressed, constitutes a solicitation of the purchase or sale of any futures or options..

INO Archive

© 2005-2022 http://www.MarketOracle.co.uk - The Market Oracle is a FREE Daily Financial Markets Analysis & Forecasting online publication.


Comments

Iconoclast421
12 Sep 08, 06:51
demand destruction
Congratulations! You have discovered demand destruction. Take a look at the 20 year graph of US VMT. http://climateprogress.org/wp-content/uploads/2008/06/vmt-april-08.gif Notice how that chart has been breaking down for very nearly 3 years now. That's about the same time that the housing bubble started breaking down. This is not something new. This is a collapse that has been building for 3 years. It is now moving with the momentum of a freight train.


gchraj@yahoo.com
05 Mar 09, 17:08
George

May be it was a typo on the Goldman Sachs document. They probably meant $20 a barrell of oil by mid 2009, not $200!


Post Comment

Only logged in users are allowed to post comments. Register/ Log in