


What Happens Next When Small Cap (Russell) Leads the Stock Market
Stock-Markets / Stock Markets 2018 May 17, 2018 - 04:49 PM GMTBy: Troy_Bombardia

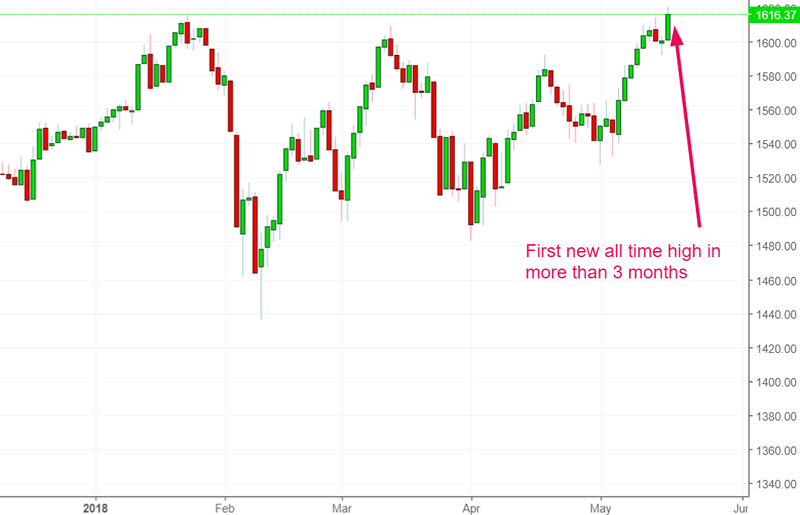
Small cap stocks (Russell 2000 Index) made a new all-time HIGH yesterday even though mid/large cap stocks (S&P 500) are still lagging. The S&P is still 5% below its all-time high.
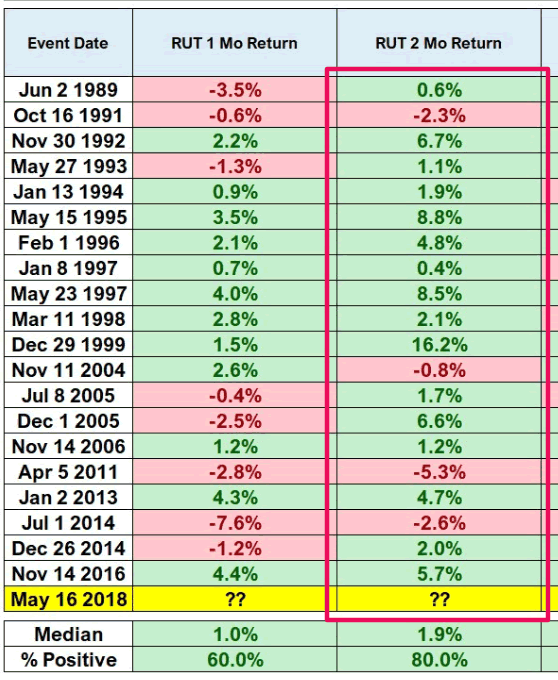
This chart demonstrates that the stock market has a medium term (2-6 month) bullish bias when the Russell 2000 makes its first new all-time high in a long time.
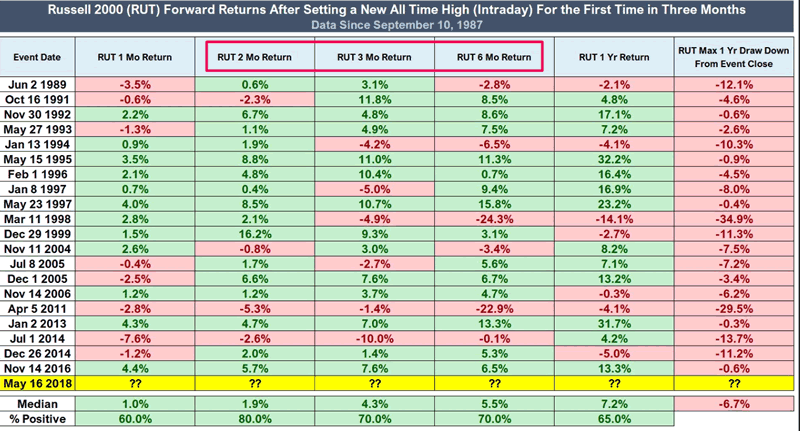
Let’s look at the specific cases in which the Russell 2000 made a new all-time high but the S&P 500 was still far below its all-time high. Here are the study’s parameters: what happens next to the stock market when…
The Russell 2000 made a new all time high.
This is the Russell 2000’s first all-time high in 3 months (63 trading days)
The S&P 500 is at least 4% below its all time high.
Here are the historical cases.
- January 2, 2013
- April 5, 2011
- November 14, 2006
- December 1, 2005
- July 8, 2005
- November 11, 2004
Here’s what happened next to the stock market (S&P 500).
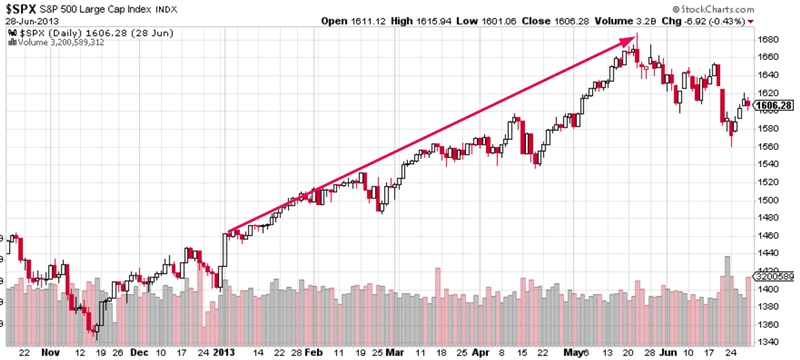
January 2, 2013
After this signal occurred, the stock market rallied for another 5.5 months before starting a 6%+ “small correction”.
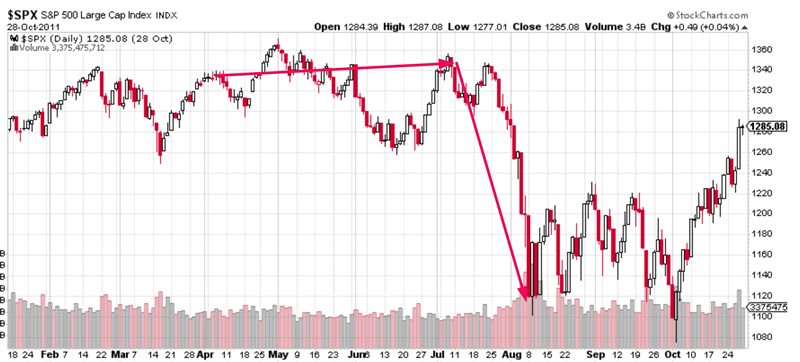
April 5, 2011
After this signal came out, the S&P 500 rallied for less than 1 month before starting a “significant correction” (which the Medium-Long Term Model predicted).
However, the stock market’s downside over the next 3 months was limited. The S&P mostly swung sideways over the next 3 months.
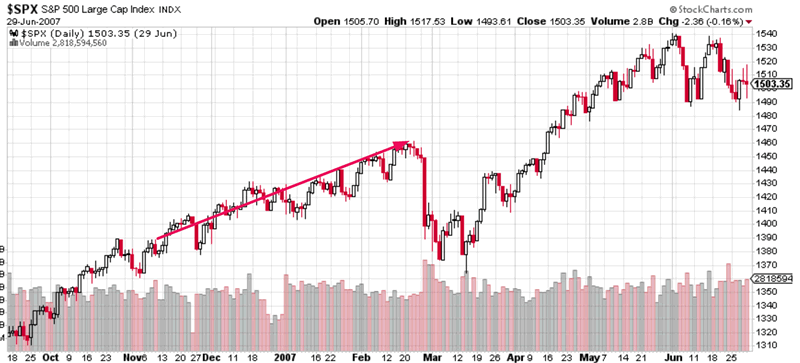
November 14, 2006
After this signal came out, the S&P rallied for another 3 months before starting a 6%+ “small correction”.
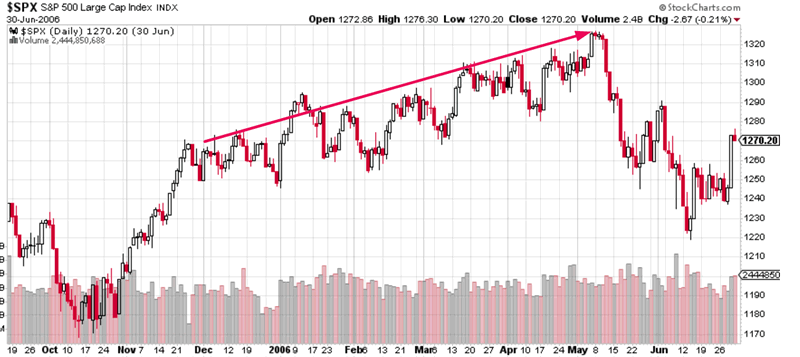
December 1, 2005
After this signal came out, the S&P rallied for another 5 months before starting a 6%+ “small correction”.
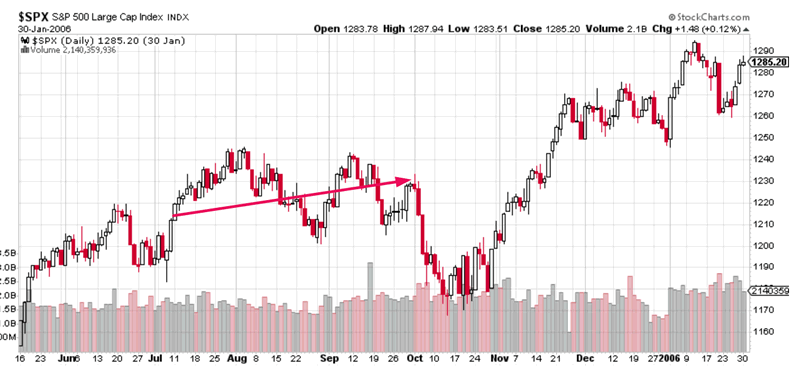
July 8, 2005
After this signal came out, the S&P rallied less than 1 month before starting a 6%+ “small correction”.
However, the stock market’s downside over the next 3 months was limited. The S&P mostly swung sideways over the next 3 months.
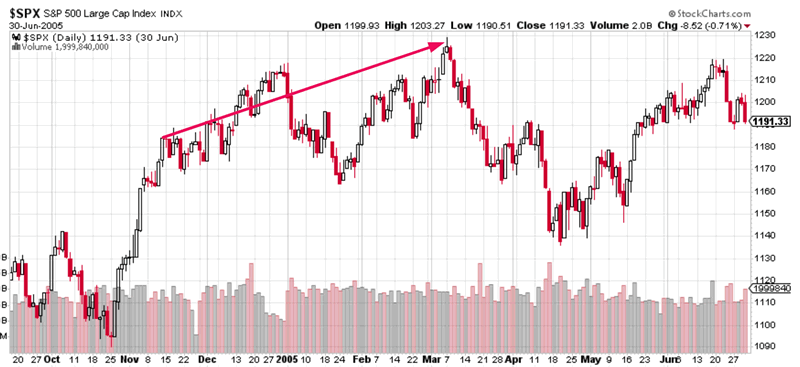
November 11, 2004
After this signal came out, the S&P rallied for another 4 months before starting a 6%+ “small correction”.
Conclusion
When small cap (Russell) led the stock market’s rally, the stock market’s downside over the next 2 months was limited. The stock market either swung sideways over the next 2 months or rallied higher.
The stock market’s performance after 2 months was more random.
Read Stocks on May 17, 2018: outlook
By Troy Bombardia
I’m Troy Bombardia, the author behind BullMarkets.co. I used to run a hedge fund, but closed it due to a major health scare. I am now enjoying life and simply investing/trading my own account. I focus on long term performance and ignore short term performance.
Copyright 2018 © Troy Bombardia - All Rights Reserved
Disclaimer: The above is a matter of opinion provided for general information purposes only and is not intended as investment advice. Information and analysis above are derived from sources and utilising methods believed to be reliable, but we cannot accept responsibility for any losses you may incur as a result of this analysis. Individuals should consult with their personal financial advisors.
© 2005-2022 http://www.MarketOracle.co.uk - The Market Oracle is a FREE Daily Financial Markets Analysis & Forecasting online publication.