


Negative Signs for EUR/USD? AUD/USD - Battle
Currencies / Forex Trading May 17, 2018 - 03:04 PM GMTBy: Nadia_Simmons

 Monday's session discovered currency bulls’ weakness, which was mercilessly used by their opponents during yesterday's trading. Thanks to the sellers’ attack, EUR/USD hit a fresh 2018 low, but will we see further declines in the coming days?
EUR/USD at Fresh 208 Lows
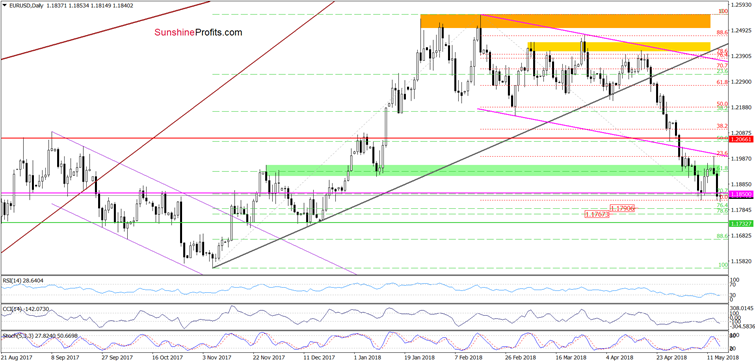
In our yesterday’s Forex Trading Alert, we wrote that currency bulls confirmed their weakness (…), which resulted in a pullback and a comeback to the green zone. Additionally, earlier today, the Stochastic Oscillator generated a sell signal, which suggests that the worst may not be behind the buyers yet and another move to the downside is just around the corner.
If this is the case, and the exchange rate declines from current levels, we could see at least a test of the 70.7% Fibonacci retracement and the last week’s low.
From today’s point of view, we see that the situation developed in line with the above scenario and EUR/USD slipped to our first downside target yesterday, making our short positions profitable.
What’s next? Taking into account Tuesday’s sellers’ strength and the above-mentioned sell signal generated by the Stochastic Oscillator, we think that EUR/USD will extend losses and test our next downside target around 1.1767-1.1790, where the support area created by the 76.4% and 78.6% retracements is.
USD/CHF vs. Major Resistance Area
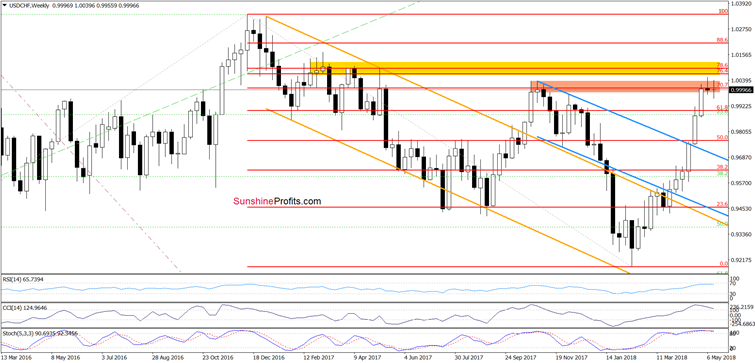
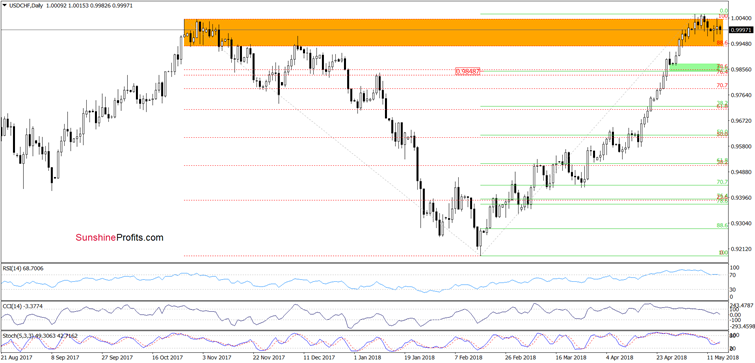
Looking at the above charts, we see that the overall situation in the short term hasn’t changed much as USD/CHF is still trading inside the orange resistance zone. Therefore, we believe that as long as there is no breakut above this area or a breakdown under the previously-broken 88.6% Fibonacci retracement another bigger move is not likely to be seen.
Nevertheless, we should keeo in mind that even if the buyers push the pair higher (using the buy signal generated by the Stochastic Oscillator) the way to the north is blocked by
the 70.7% Fibonacci retracement and the yellow resistance zone (seen on the weekly chart), which stopped the rally and triggered a pullback in the previous week.
And what could happen if USD/CHF drops under the orange zone? In our opinion, if the exchange rate slips under the lower border of this area, we could see a drop to around 0.9850-0.9875, where the green support zone (marked on the daily chart) is.
AUD/USD - Battle Around Lower Border of Trend Channel
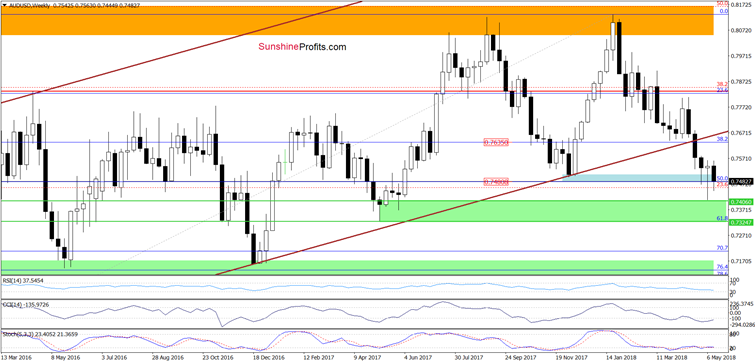
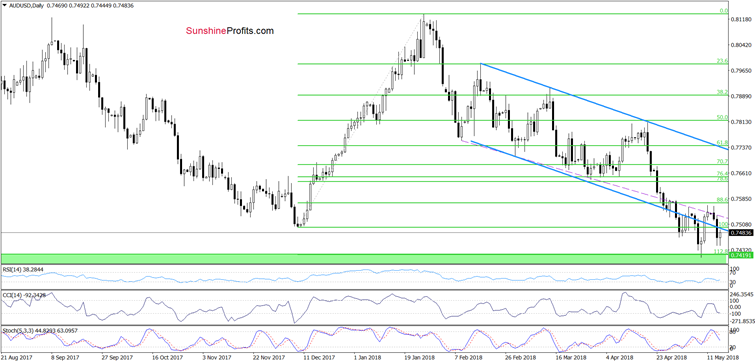
On the daily chart, we see that although currency bulls managed to take AUD/USD above the previously-broken lower border of the blue declining trend channel at the end of the last week, this improvement was very temporary.
Why? Because their opponents showed strength and invalidated the earlier breakout yesterday, triggering a quite sharp decline. This is a bearish development, which in combination with the sell signal generated by the Stochastic Oscillator suggests that we could see a re-test of the May low and the green support zone in the coming day(s).
If you enjoyed the above analysis and would like to receive free follow-ups, we encourage you to sign up for our daily newsletter – it’s free and if you don’t like it, you can unsubscribe with just 2 clicks. If you sign up today, you’ll also get 7 days of free access to our premium daily Oil Trading Alerts as well as Gold & Silver Trading Alerts. Sign up now.
Nadia Simmons
Forex & Oil Trading Strategist
Przemyslaw Radomski
Founder, Editor-in-chief
Sunshine Profits: Gold & Silver, Forex, Bitcoin, Crude Oil & Stocks
Stay updated: sign up for our free mailing list today
* * * * *
Disclaimer
All essays, research and information found above represent analyses and opinions of Nadia Simmons and Sunshine Profits' associates only. As such, it may prove wrong and be a subject to change without notice. Opinions and analyses were based on data available to authors of respective essays at the time of writing. Although the information provided above is based on careful research and sources that are believed to be accurate, Nadia Simmons and his associates do not guarantee the accuracy or thoroughness of the data or information reported. The opinions published above are neither an offer nor a recommendation to purchase or sell any securities. Nadia Simmons is not a Registered Securities Advisor. By reading Nadia Simmons’ reports you fully agree that he will not be held responsible or liable for any decisions you make regarding any information provided in these reports. Investing, trading and speculation in any financial markets may involve high risk of loss. Nadia Simmons, Sunshine Profits' employees and affiliates as well as members of their families may have a short or long position in any securities, including those mentioned in any of the reports or essays, and may make additional purchases and/or sales of those securities without notice.
© 2005-2022 http://www.MarketOracle.co.uk - The Market Oracle is a FREE Daily Financial Markets Analysis & Forecasting online publication.