Stock Futures Are on a Sell Signal
Stock-Markets / Stock Markets 2018 May 16, 2018 - 02:30 PM GMT Good Morning!
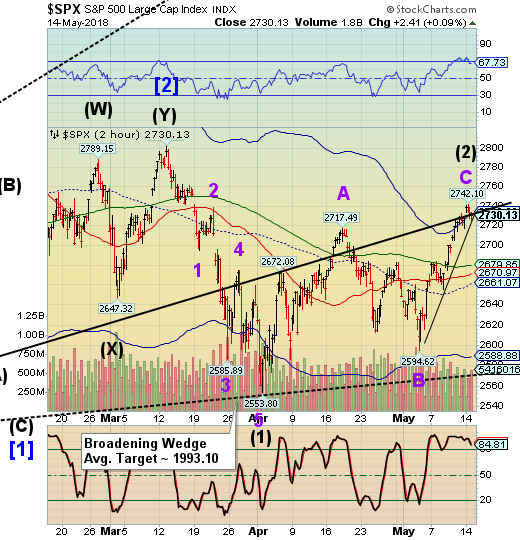
SPX futures are sliding as low as 2720.50 this morning, potentially breaking beneath the rally trendline at 2725.00. This gives the SPX an aggressive sell signal that will await confirmation from the VIX and NYSE Hi-Lo Index. Aggressive signals are subject to drawdowns, so take due care with any new positions.
ZeroHedge reports, “The pain trade has returned with a bang this morning as both 10Y Treasury yields and the dollar are grinding higher, the former back above 3.00%...
... the latter at the highest level since last Wednesday as oil continued to advance and soak up liquidity...
... in the process slamming near record Treasury and USD shorts - hence "pain trade" - while leaving a risk-off flavor to markets on Tuesday, with European stocks struggling for traction following declines across Asia, which saw a disappointing set of data out of China overnight , while US futures were roughly 0.2% lower around 7am ET.
NDX futures are down and appear to have broken the rally trendline as well. The break of a rally trendline may be considered an aggressive sell signal with confirmation at the 50-day Moving Average at 6745.35.
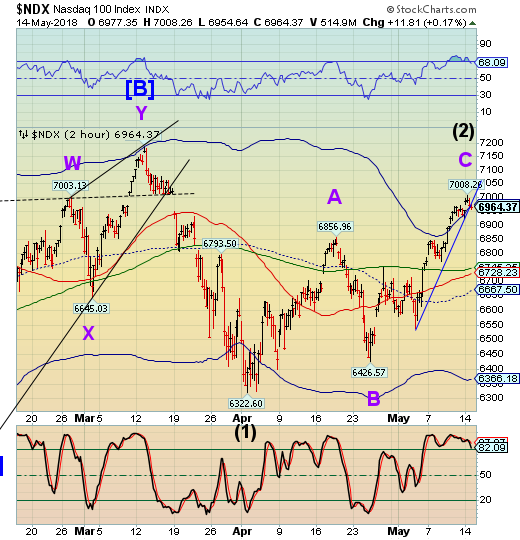
The equities Cycles Model suggests that, once the decline begins, we may see a two-month decline that may wipe out 50-60% of the equity values. In other words, Wave (3) may take that long before it is finished.
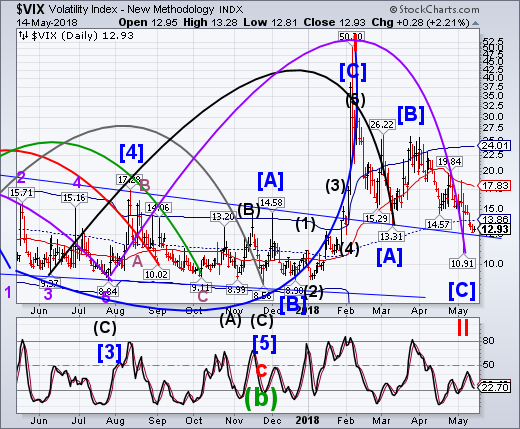
VIX futures are higher, but must cross the mid-cycle resistance at 13.86 for a buy signal. With a futures high of 13.26, VIX has a way to go yet for a signal.
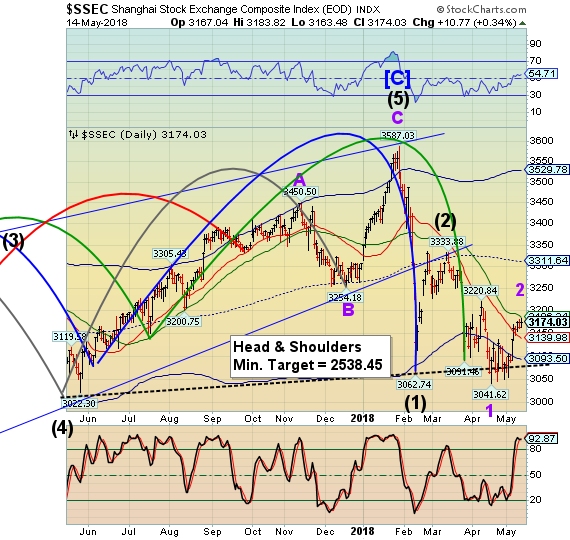
The Shanghai Index touched its 50-day Moving Average yesterday and appears prepared to begin its decline. We’ll be watching for a cross of Intermediate-term support at 3139.98 , then the Head and Shoulders neckline at 3080.00-3090.00. for confirmation of the next leg down.
ZeroHedge comments, “China’s economic momentum appeared to slow from March's data as while Industrial Production handsomely beat expectations, Retail Sales were below the lowest estimate and Fixed Asset Investment was the weakest since Dec 1999...
Industrial output rose 7.0 percent in April from a year earlier, versus a projected 6.4 percent in a Bloomberg survey and 6 percent in March - highest since June 2017
Retail sales expanded 9.4 percent from a year earlier, versus a forecast 10 percent - equal lowest since Feb 06
Fixed-asset investment rose 7.0 percent year-on-year in the first four months, compared with an estimated 7.4 percent - lowest since Dec 1999.
TNX is testing its prior high at 30.35, but hasn’t yet reached it. Remember, it can go up to 30.35, but not beyond, to remain in the current Wave structure.
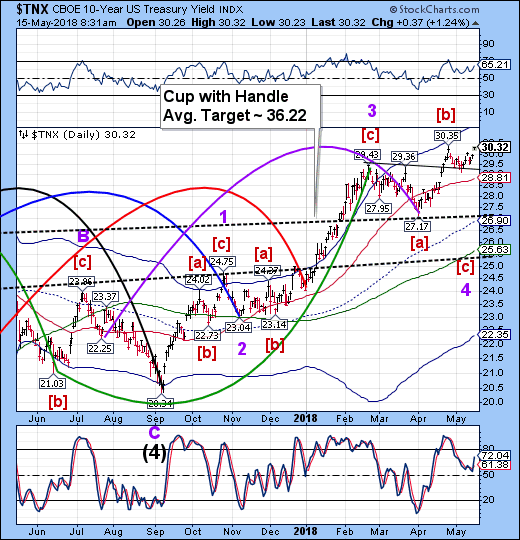
The Commitment of Traders shows that on May 14, the Commercial Traders are 639852 contracts long, while the Large Specs (-408629) and Small Specs (-231222) have the opposite wager. This is a very lopsided trade, which suggests that yields may go down hard, should the markets break. The tension is palpable.
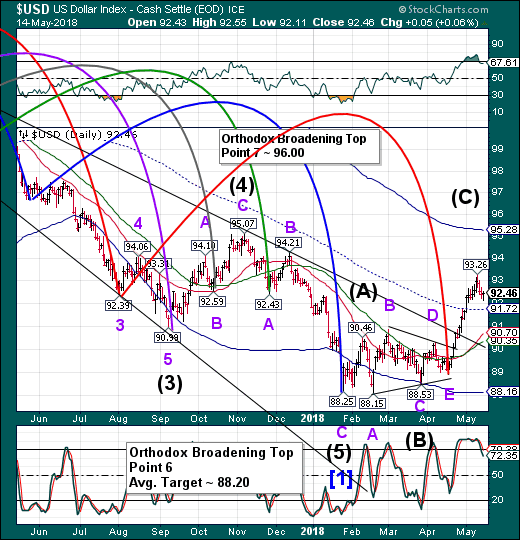
USD futures are charging higher after the USD probed toward, but did not make, the mid-Cycle support at 91.72. The Cycles Model suggests that strength may return to the USD for the next week. It this possibly a Wave 3? The next target appears to be the Cycle Top at 95.28. Point 7 may be higher than that, but we will have to evaluate as the rally progresses.
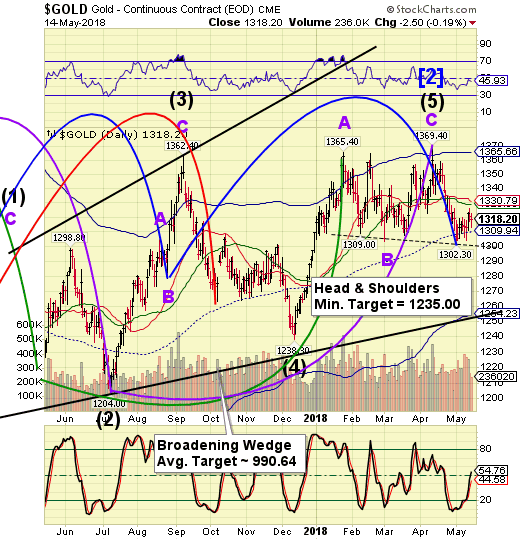
Gold futures have taken a big hit this morning, having declined beneath its previous low. Futures were as low as 1296.20, crossing a potential Head & Shoulders neckline at 1300.00. The Cycles Model suggests a week-long decline that may make the Head & Shoulders target.
Regards,
Tony
Our Investment Advisor Registration is on the Web.
We are in the process of updating our website at http://mrpracticalinvestor.com/ to have more information on our services. Log on and click on Advisor Registration to get more details.
If you are a client or wish to become one, please make an appointment to discuss our investment strategies by calling Connie or Tony at (517) 699-1554, ext 10 or 11. Or e-mail us at tpi@thepracticalinve4stor.com .
Anthony M. Cherniawski, President and CIOhttp://mrpracticalinvestor.com
As a State Registered Investment Advisor, The Practical Investor (TPI) manages private client investment portfolios using a proprietary investment strategy created by Chief Investment Officer Tony Cherniawski. Throughout 2000-01, when many investors felt the pain of double digit market losses, TPI successfully navigated the choppy investment waters, creating a profit for our private investment clients. With a focus on preserving assets and capitalizing on opportunities, TPI clients benefited greatly from the TPI strategies, allowing them to stay on track with their life goals.
Disclaimer: The content in this article is written for educational and informational purposes only. There is no offer or recommendation to buy or sell any security and no information contained here should be interpreted or construed as investment advice. Do you own due diligence as the information in this article is the opinion of Anthony M. Cherniawski and subject to change without notice.
Anthony M. Cherniawski Archive |
© 2005-2022 http://www.MarketOracle.co.uk - The Market Oracle is a FREE Daily Financial Markets Analysis & Forecasting online publication.


