


Stock Market Study: What Happens Next when Dow Goes Up 8 Days in a Row
Stock-Markets / Stock Markets 2018 May 15, 2018 - 06:02 PM GMTBy: Troy_Bombardia

 The Dow Jones Industrial Average has gone up 8 days in a row (using CLOSE $). What’s unusual is that this is happening before the Dow has hit a new all-time high. These “up 8 consecutive days” events usually happen when the stock market is making new highs.
Here are the historical cases in which the Dow closed higher 8 days in a row, and what happened next to the stock market (Dow and S&P 500).
*This is a rather common event, so we’re only looking at the historical cases in this current bull market, which began in March 2009.
- May 14, 2018 (current case)
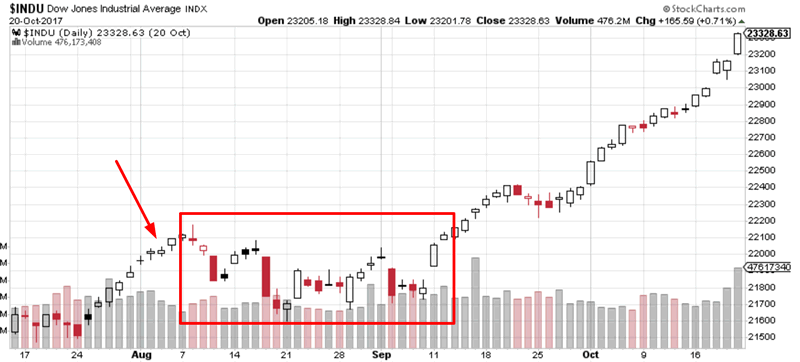
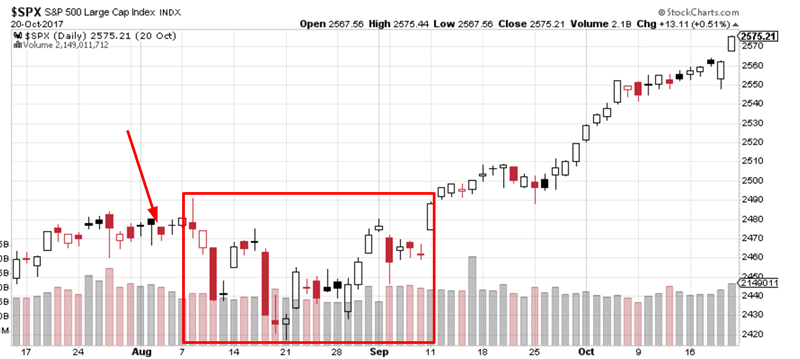
- August 3, 2017 (ended up being 10 consecutive days)
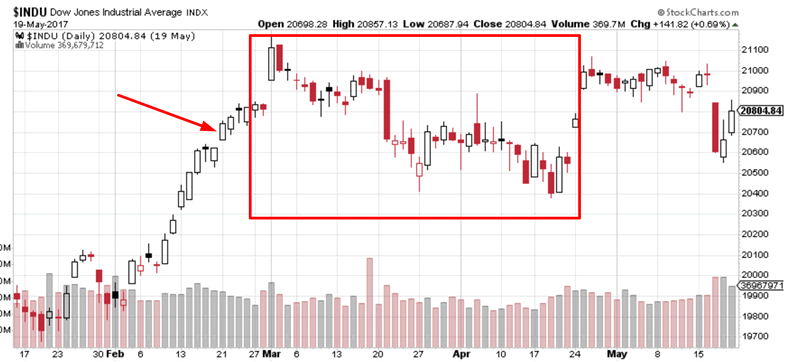
- February 21, 2017 (ended up being 12 consecutive days)
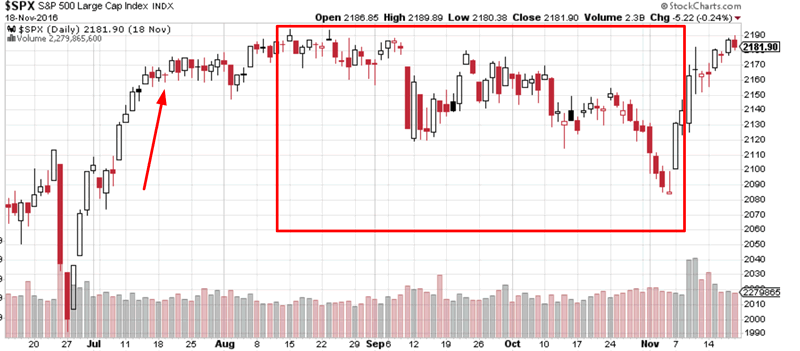
- July 19, 2016 (ended up being 9 consecutive days)
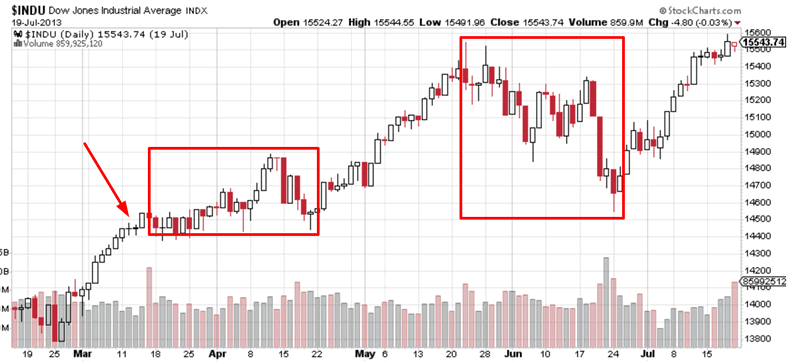
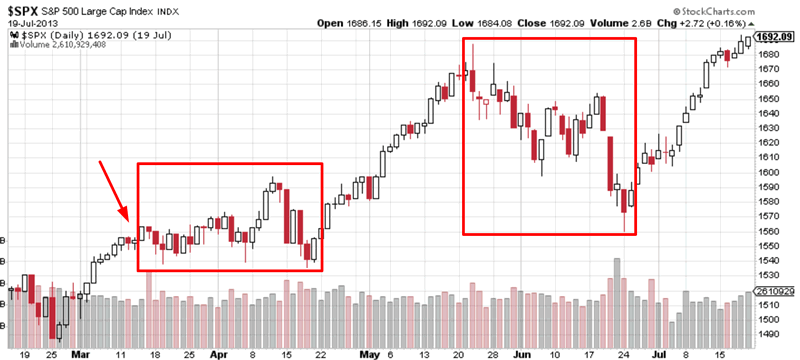
- March 12, 2013 (ended up being 10 consecutive days)
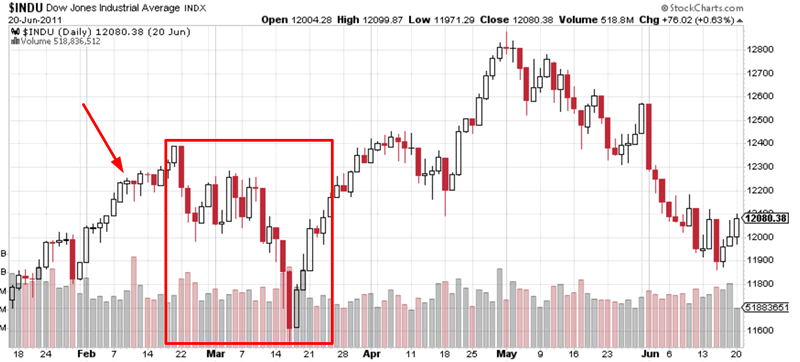
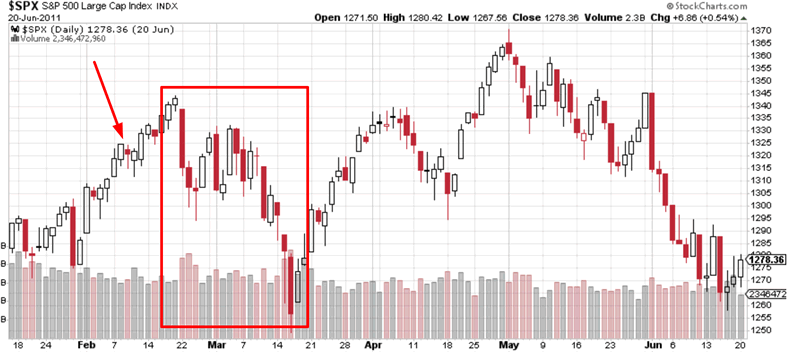
- February 9, 2011
- March 18, 2010
- August 27, 2009
*This is a SHORT TERM market study. The Dow going up 8 days in a row tells us nothing about what the stock market does during the medium-long term. It only tells us what the stock market will do next in the short term.
August 3, 2017 (ended up being 10 consecutive days)
The Dow ended up rallying 10 days in a row. It then made a pullback that lasted approximately 1 month. The S&P 500 did likewise.
February 21, 2017 (ended up being 12 consecutive days)
The Dow ended up rallying 12 days in a row. It then made a pullback that lasted approximately 1.5 months. The S&P 500 did likewise.
July 19, 2016 (ended up being 9 consecutive days)
Once this “8 days up” streak was broken, the Dow made a big pullback that lasted 3 months (this came close to being a “small correction”). The S&P 500 did likewise.

March 12, 2013 (ended up being 10 consecutive days)
The Dow ended up closing higher 10 days in a row. Then it consolidated sideways over the next month before trending higher. The uptrend was choppy. The S&P 500 did likewise.
February 9, 2011
The Dow and S&P soon began 6%+ “small corrections”.
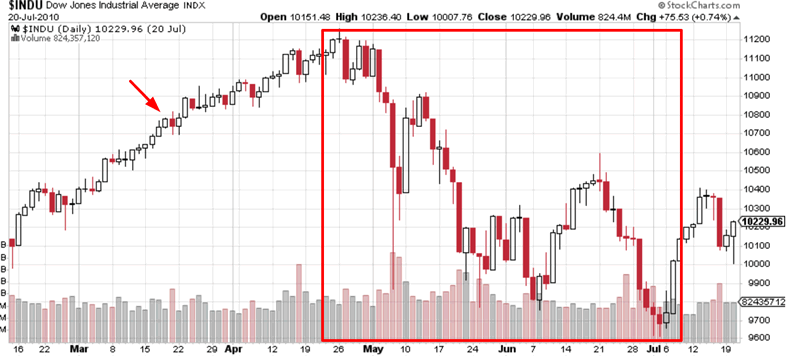
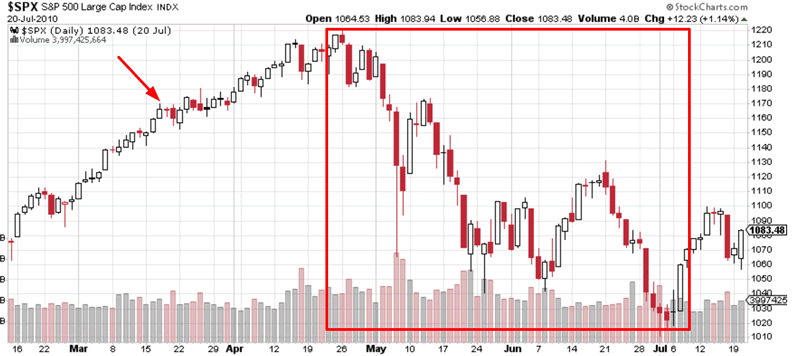
March 18, 2010
The Dow and S&P rallied for 1 more month before starting “significant corrections”. The Medium-Long Term Model predicted these “significant corrections”.
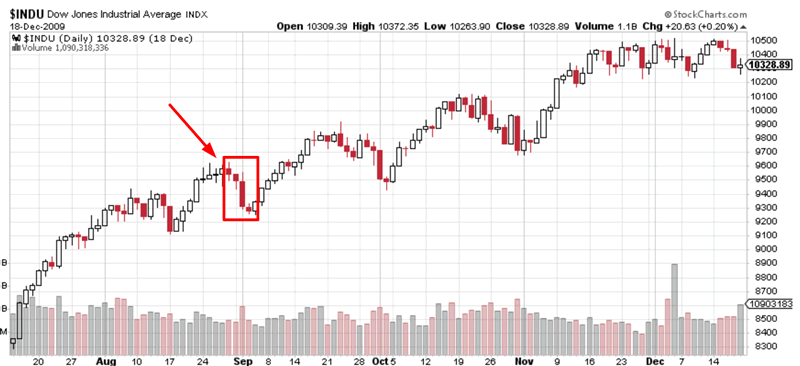
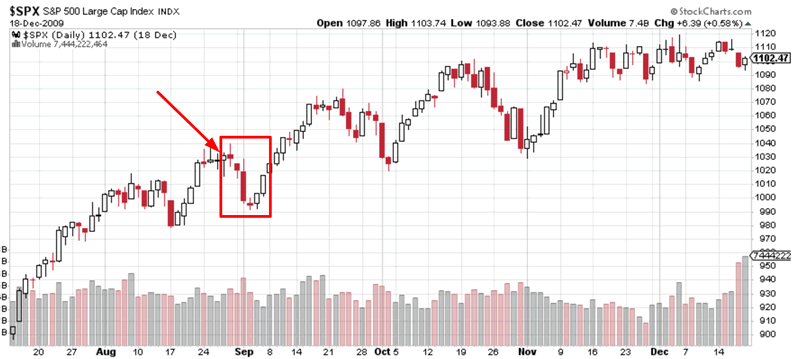
August 27, 2009
The Dow and S&P immediately made a pullback.
Conclusion
With the Dow closing higher 8 days a row, now is not the best time to buy stocks if you missed the February/April 2018 bottom. There’s a high probability that the stock market will at least make a small pullback. The short term risk:reward is skewed towards the downside.
Read Stocks on May 15, 2018: outlook
By Troy Bombardia
I’m Troy Bombardia, the author behind BullMarkets.co. I used to run a hedge fund, but closed it due to a major health scare. I am now enjoying life and simply investing/trading my own account. I focus on long term performance and ignore short term performance.
Copyright 2018 © Troy Bombardia - All Rights Reserved
Disclaimer: The above is a matter of opinion provided for general information purposes only and is not intended as investment advice. Information and analysis above are derived from sources and utilising methods believed to be reliable, but we cannot accept responsibility for any losses you may incur as a result of this analysis. Individuals should consult with their personal financial advisors.
Troy Bombardia Archive |
© 2005-2022 http://www.MarketOracle.co.uk - The Market Oracle is a FREE Daily Financial Markets Analysis & Forecasting online publication.