


Energy Sector Congestion Basing Can Present Incredible Opportunities
Companies / Sector Analysis May 14, 2018 - 08:46 AM GMTBy: Chris_Vermeulen

 Our research team wanted to alert our followers to the incredible opportunities that continue to present themselves in the current market. While many people have been overly concerned about a market top and price rotation in the US majors, the Energy sector and many others have seen incredible price moves.
Take a look at this XLE chart as an example. Yes, we know that Oil has rallied from about $60 to closer to $70 recently, yet we want you to focus on the price pattern that setup this move in XLE. Specifically, we want you to focus on the Multi-Month Base pattern in price between early February and early April of 2018 as well as the upside breakout that followed.
In true technical analysis theory, price tells us everything and indicators assist us in relating current price movement/action to historical price movement/action. This simple chart illustrates how price setup a top/resistance zone near $78 in early January 2018, broke lower in early February, then setup a multi-month price support base for nearly 60+ days. This price support base because an extended bottom formation and a “price support zone” by testing and retesting the critical $65~66 price level while establishing a series downward sloping high price peaks. When it finally broke free of this support zone, near mid-April, price skyrocketed higher (+17% or more).
With the stock market showing all the signs that it is in the late stage of a bull market this is when traders need to start identifying the hot sectors or high probability continuation patterns. Why? because we have entered a stock pickers market. It’s simple really, it means all the stocks are not going to be rising together and if you put your money into the wrong sector you could lose money while the markets rise.
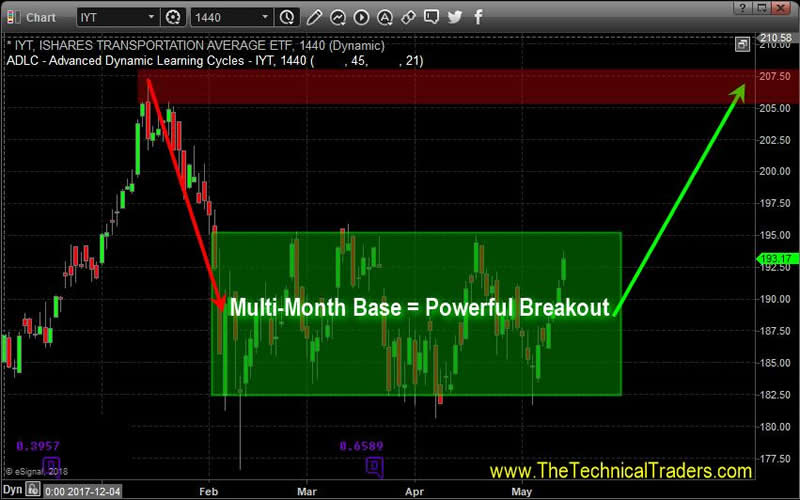
So where is the next hot sector? we believe a very similar pattern is setting up in the IYT (Transportation Index) just like we saw on the first chart of the XLE. We feel an upside breakout move is likely to happen within the next two weeks.
The setup of this price pattern is a bit broader and more volatile than the XLE Multi-Month Basing pattern – which means the IYT upside breakout could be more volatile and dramatic in form (possibly driving price +10% to 20% over an extended period).
Additionally, the high price peaks are setting up in a similar format with lower high price peaks over the span of the base. Support near $182.50 to $185 is critical and we believe the eventual upside breakout will be an incredible opportunity for traders.
This breakout will coincide with much of our other analysis of the US major markets which we have been sharing recently.
Our other recent trade alerts, that are up well over 10% each are UGAZ, FAS, and TECL. These have been rocketing higher – as we predicted. On Friday we closed our TECL position which hit our resistance level and we locked in the 18.3% gains with our members. The single point of success for all of us is to manage our assets well in an attempt to achieve greater long-term success.
If you have not seen or read much of our recent analysis, please visit www.TheTechnicalTraders.com to learn more and review our work. Our exclusive members are already positioned for many moves like this in the markets and more continue to form each week.
We urge you to consider joining our Wealth Building Trading Newsletter as a member to receive our incredible insight, proprietary research, and trade alerts to assist your own trading success. We have delivered insights and research to our members that have clearly informed them of where we believe the markets are headed for many months in advance. Imagine how powerful that kind of research could be for you?
53 years experience in researching and trading makes analyzing the complex and ever-changing financial markets a natural process. We have a simple and highly effective way to provide our customers with the most convenient, accurate, and timely market forecasts available today. Our stock and ETF trading alerts are readily available through our exclusive membership service via email and SMS text. Our newsletter, Technical Trading Mastery book, and 3 Hour Trading Video Course are designed for both traders and investors. Also, some of our strategies have been fully automated for the ultimate trading experience.
Chris Vermeulen
www.TheTechnicalTraders.com
Chris Vermeulen has been involved in the markets since 1997 and is the founder of Technical Traders Ltd. He is an internationally recognized technical analyst, trader, and is the author of the book: 7 Steps to Win With Logic
Through years of research, trading and helping individual traders around the world. He learned that many traders have great trading ideas, but they lack one thing, they struggle to execute trades in a systematic way for consistent results. Chris helps educate traders with a three-hour video course that can change your trading results for the better.
His mission is to help his clients boost their trading performance while reducing market exposure and portfolio volatility.
He is a regular speaker on HoweStreet.com, and the FinancialSurvivorNetwork radio shows. Chris was also featured on the cover of AmalgaTrader Magazine, and contributes articles to several leading financial hubs like MarketOracle.co.uk
Disclaimer: Nothing in this report should be construed as a solicitation to buy or sell any securities mentioned. Technical Traders Ltd., its owners and the author of this report are not registered broker-dealers or financial advisors. Before investing in any securities, you should consult with your financial advisor and a registered broker-dealer. Never make an investment based solely on what you read in an online or printed report, including this report, especially if the investment involves a small, thinly-traded company that isn’t well known. Technical Traders Ltd. and the author of this report has been paid by Cardiff Energy Corp. In addition, the author owns shares of Cardiff Energy Corp. and would also benefit from volume and price appreciation of its stock. The information provided here within should not be construed as a financial analysis but rather as an advertisement. The author’s views and opinions regarding the companies featured in reports are his own views and are based on information that he has researched independently and has received, which the author assumes to be reliable. Technical Traders Ltd. and the author of this report do not guarantee the accuracy, completeness, or usefulness of any content of this report, nor its fitness for any particular purpose. Lastly, the author does not guarantee that any of the companies mentioned in the reports will perform as expected, and any comparisons made to other companies may not be valid or come into effect.
Chris Vermeulen Archive |
© 2005-2022 http://www.MarketOracle.co.uk - The Market Oracle is a FREE Daily Financial Markets Analysis & Forecasting online publication.