The US Dollar Crash of 2018
Currencies / US Dollar May 12, 2018 - 03:46 PM GMTBy: Austin_Galt
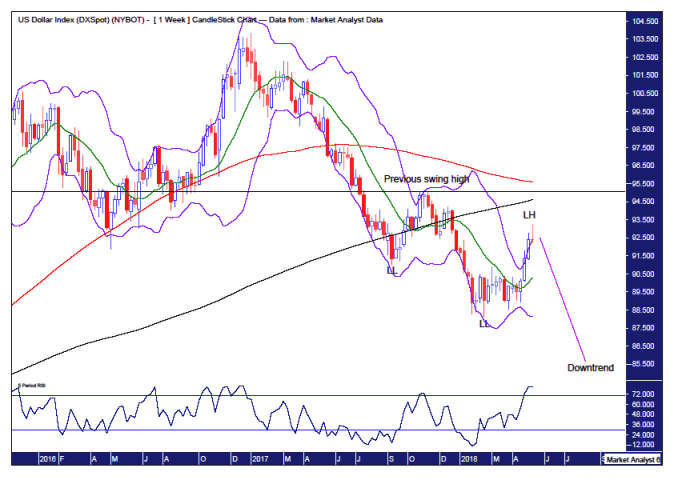
Price has rallied solidly over the last few weeks however absolutely no damage has been done to the overall downtrend and I believe a mini crash will occur over the coming months that sees price drop down to around the 80 level.
Weekly Chart

Pattern – the rally of the last few weeks does no damage to the pattern of lower lows and lower highs. It actually looks like a little fake out move that gets the crowd offside before reversing direction. I expect this seemingly stock standard downtrend to gather momentum going forward from here.
Bollinger Bands – price is at the upper band and has not shown any sign of leaving it yet. The only real takeaway for the bears here is that this week’s high traded well above the upper band which is often found at highs.
Horizontal line – denotes previous swing high of 95.07 and price closing above that level would likely mean a new bull trend is in play. I seriously doubt that scenario.
Moving averages – in a bullish position with the 100 week moving average (red) above the 200 week moving average (black) and I expect a move down now n price to bring these averages closer together and threaten a death cross.
RSI – very overbought.
Monthly Chart

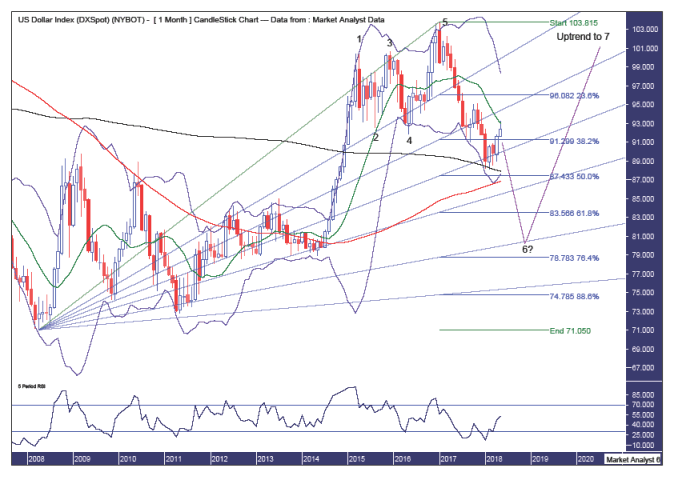
Pattern – a 5 point broadening top is in place however I believe this will morph into an even more bearish 7 point broadening top. Firstly, I expect this move down to form a point 6 low and I am looking for a mini crash to occur on the way down into that low. Only then can price turn back up and commence a massive run higher that will put this expected mini crash to shame.
Bollinger Bands – price rallied back to the middle band and I expect resistance to be strong here and send price back down.
Fibonacci – the 50% angle has provided some support but I doubt it will bring in the final low. Personally, I am targeting the 76.4% angle to see to that. I am also looking for price to at least clip the 618% retracement level at 83.56 while the 76.4% level of 78.78 is certainly not out of the question. Let’s just say around the 80 level is my clear target for low.
Moving averages – in a bearish position.
RSI – just into strong territory above the 50 level but generally in a downtrend with a pattern of lower lows and lower highs.
Summing up – a downtrend still dominates despite the recent rally and I expect this downtrend to gather momentum and lead to a mini crash that sees a price drop at least 10% over the coming months.
By Austin Galt
Austin Galt has previously worked as a stockbroker and investment banker while studying technical analysis for over two decades. He is also the author of the book White Night: A Colombian Odyssey
Email - info@thevoodooanalyst.com
© 2018 Copyright The Voodoo Analyst - All Rights Reserved
Disclaimer: The above is a matter of opinion provided for general information purposes only and is not intended as investment advice. Information and analysis above are derived from sources and utilising methods believed to be reliable, but we cannot accept responsibility for any losses you may incur as a result of this analysis. Individuals should consult with their personal financial advisors.
Austin Galt Archive |
© 2005-2022 http://www.MarketOracle.co.uk - The Market Oracle is a FREE Daily Financial Markets Analysis & Forecasting online publication.


 Latest Price – 92.41