


Do Corporate Earnings Lead the Stock Market?
Stock-Markets / Corporate Earnings May 08, 2018 - 12:23 PM GMTBy: Troy_Bombardia

 I’ve been building more quantitative trading models recently. I know that some hedge funds calculate the stock market’s “fair value” and then trade around that fair value. For the record, this is not what I do with the Medium-Long Term Model.
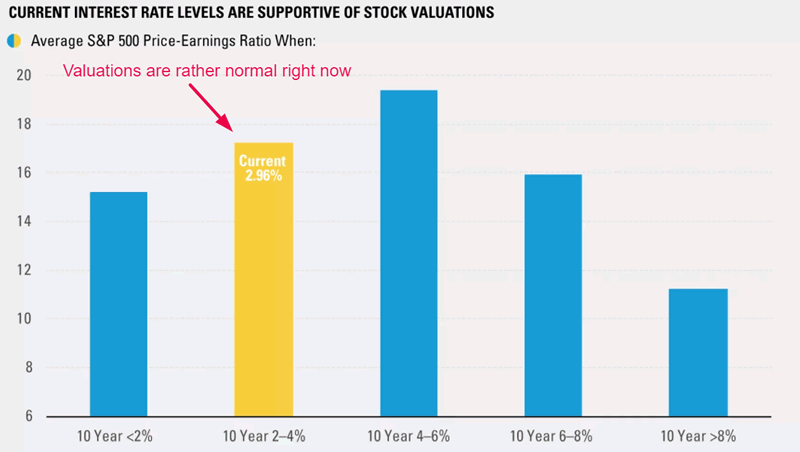
This “fair value” is usually “the stock market’s average P/E ratio during certain market environments”. Here’s an example of how the stock market’s average valuation (P/E ratio) – aka “fair value” – changes based on changes in interest rates.
Remember what I said:
The economy drives earnings, which drives the stock market. Hence, the economy leads earnings and the stock market in the long run.
Yesterday I had a question. The economy leads the stock market. But what about earnings? Do corporate earnings lead the stock market in the long run too? This chart from April 30 demonstrated that the stock market peaks AFTER earnings growth has already peaked.
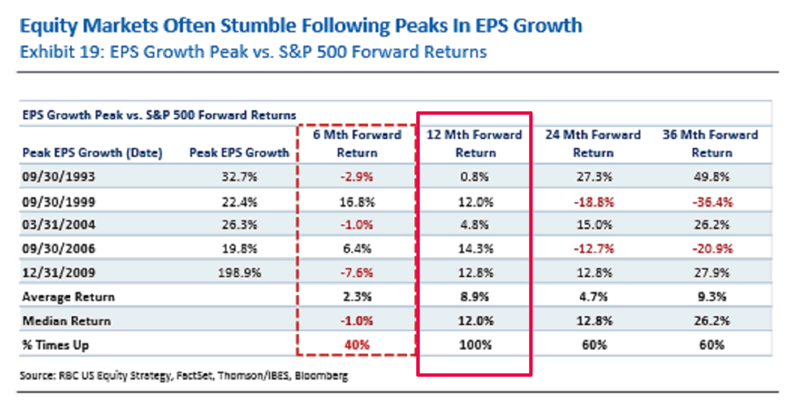
This question is especially pertinent right now. The bears are afraid of “peak earnings growth”. They think that the stock market is medium-long term bearish because earnings growth can’t possibly get better (which is true – we’ve probably hit peak earnings growth in this cycle thanks to the Trump tax cut).
But what the chart above clearly demonstrates is that the stock market does not move in sync with earnings GROWTH. Perhaps it moves in sync with earnings. My hypothesis is:
- The stock market doesn’t move up and down based on whether earnings growth is INCREASING or DECREASING.
- The stock market moves up and down based on whether earnings (absolute value of earnings, not GROWTH) are increasing or decreasing.
See the critical difference here? The first focuses on earnings GROWTH. The second focuses on the absolute value of corporate earnings itself.
So here’s my more important hypothesis.
Do corporate earnings lead the stock market? I.e. does corporate earnings flatten or trend downwards before a bear market in stocks begin?
I tested 2 versions of this hypothesis:
- Nominal corporate earnings (not adjusted for inflation)
- Inflation-adjusted corporate earnings (inflation adjusted).
I used the S&P 500’s 12 month backwards earnings. You can find the data here and here.
*I didn’t use the S&P 500’s 12 month forwards earnings. Forward earnings = analysts’ expectations. Forward earnings tends to LAG the stock market because analysts tend to let the stock market’s direction lead their thinking. Analysts tend to ratchet up their forward earnings expectations as the stock market goes up. This was plainly clear in 2007. 12 month backwards earnings had peaked months before October 2007 (when the stock market peaked), but forward earnings lagged backwards earnings.
Nominal value of corporate earnings is not a good leading indicator for the stock market
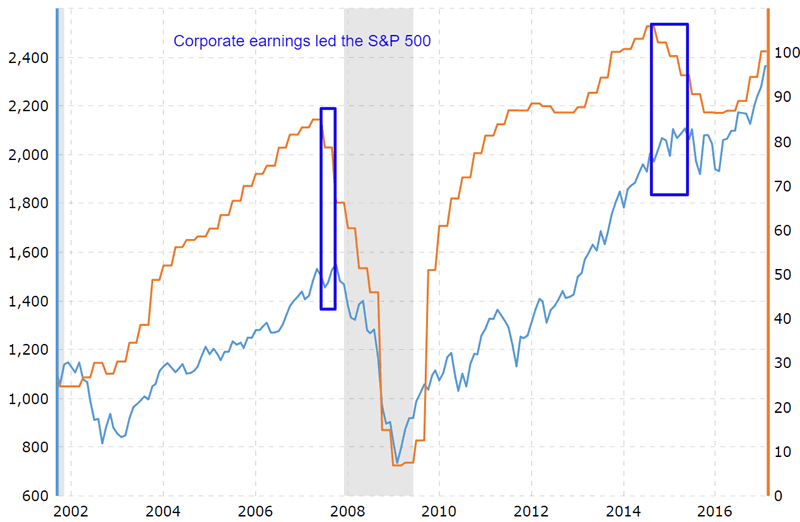
Sometimes non-inflation adjusted adjusted corporate earnings lead the stock market. You can see this in the 2015-2016 significant correction and the 2007-2009 bear market.
Notice how corporate earnings turned downwards before the stock market peaked.
- Corporate earnings peaked in September 2014. The S&P peaked in May 2015.
- Corporate earnings peaked in May 2007. The S&P peaked in October 2007.
*Orange line = corporate earnings. Blue line = S&P 500.
But in other cases, corporate earnings peaked AFTER the stock market had made a bull market peak.
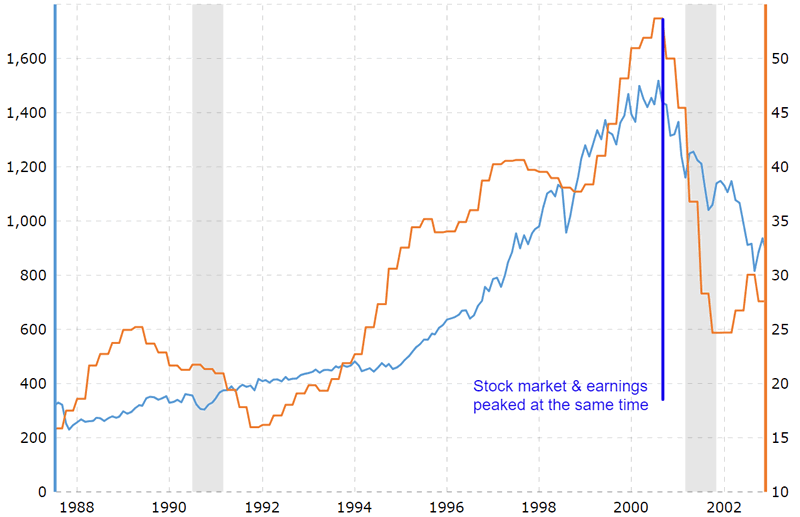
This chart demonstrates how the S&P 500 made a flat top from March – September 2000. Corporate earnings peaked in September 2000. In other words, corporate earnings and the S&P peaked around the same time in this bull market cycle. This was a coincident indicator – not a leading indicator. We can still use coincident indicators to calculate “fair value”.
But the 1968-1970 and 1973-1974 bear markets were a problem. Corporate earnings peaked AFTER the S&P peaked in both of these bear markets.
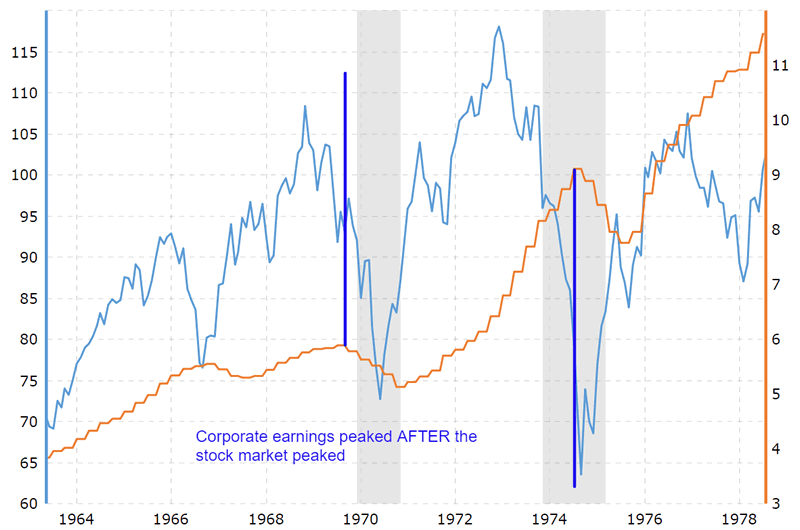
The 1973-1974 bear market was an especially egregious example. Corporate earnings peaked near the END of the bear market!
So what gives? Why would corporate earnings rise during a severe recession?
The answer to that is INFLATION. Inflation went up during the 1968-1970 and 1973-1974 bear markets.
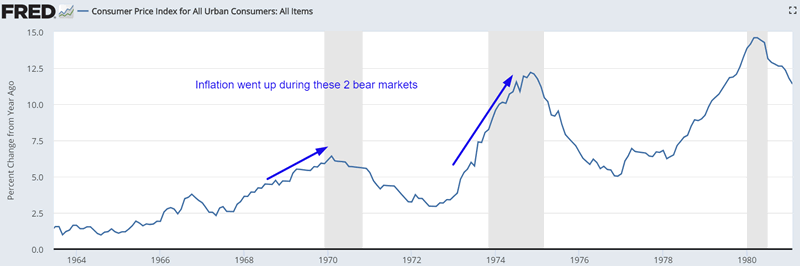
So perhaps corporate earnings went up during the 1968-1970 and 1973-1974 bear markets ONLY because inflation went up. That’s why I took the monthly corporate earnings data and divided it by CPI (to account for inflation).
You can download this data here in Excel.
Do inflation-adjusted earnings lead the stock market?
Let’s look at the 4 historical bear markets.
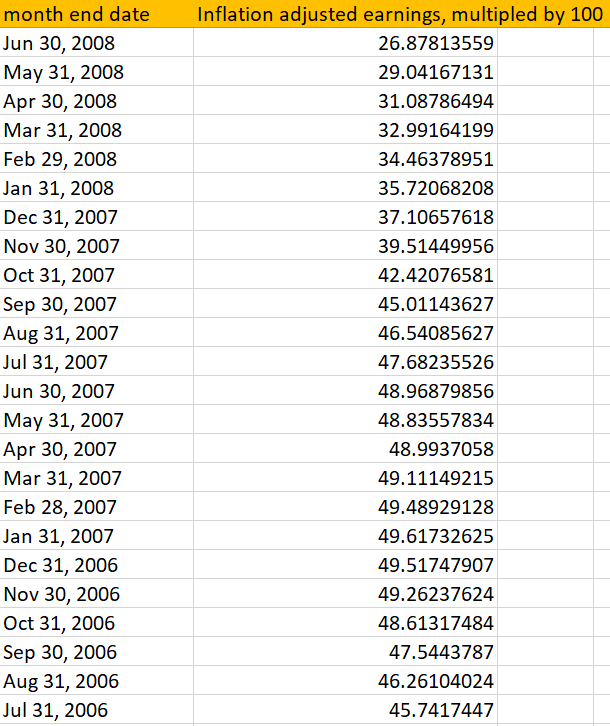
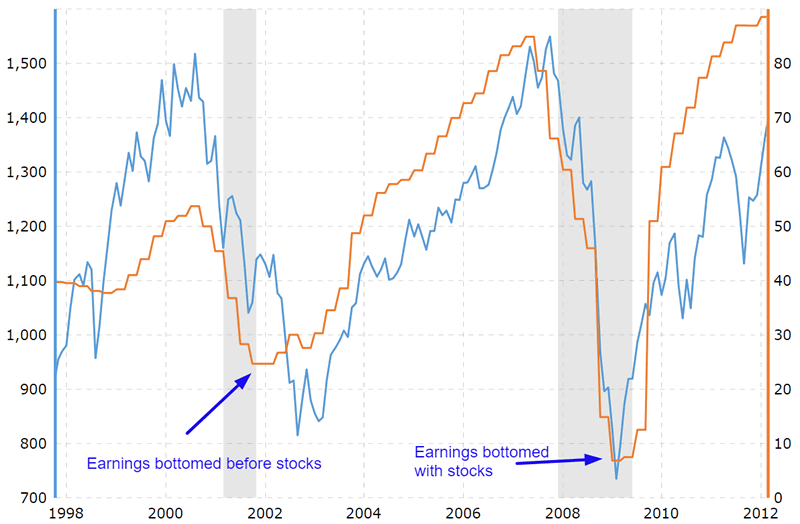
2007-2009
Inflation adjusted corporate earnings led the stock market in this case. Adjusted earnings peaked in January 2007. Earnings were down significantly by the time the S&P peaked in October 2007. Leading indicator.
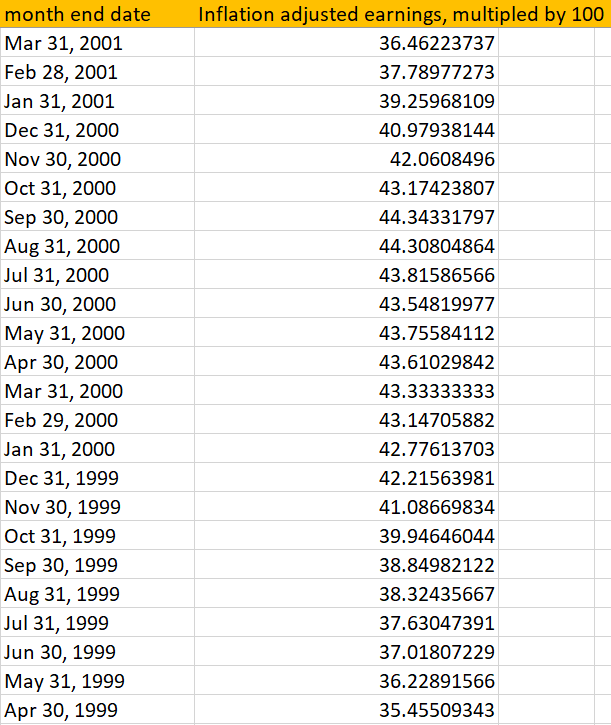
2000-2002
Like the non-inflation adjusted earnings, inflation-adjusted earnings peaked at the same time as the S&P 500. Coincident indicator.
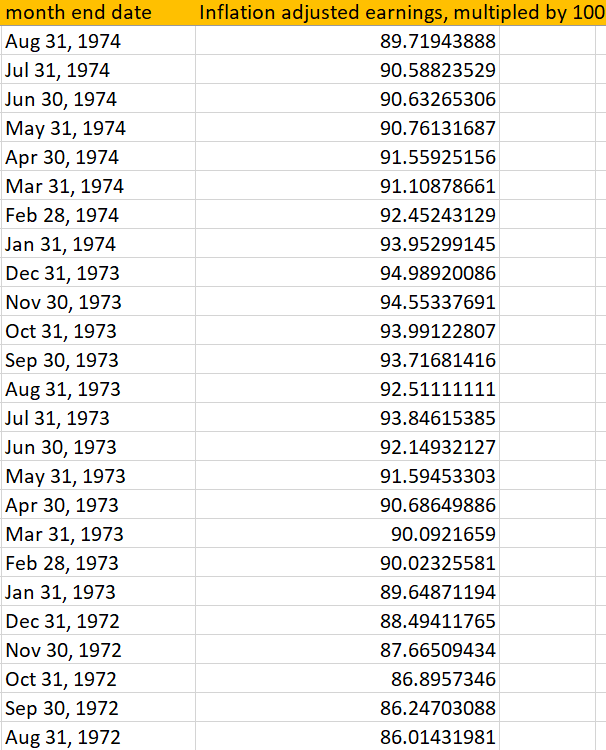
1973-1974
As you can see, adjusting corporate earnings for inflation clearly solved the problem of soaring earnings during this bear market. Real (inflation-adjusted) earnings peaked in December 1973. But that was still almost 1 year after the S&P peaked in January 1973. Lagging indicator.
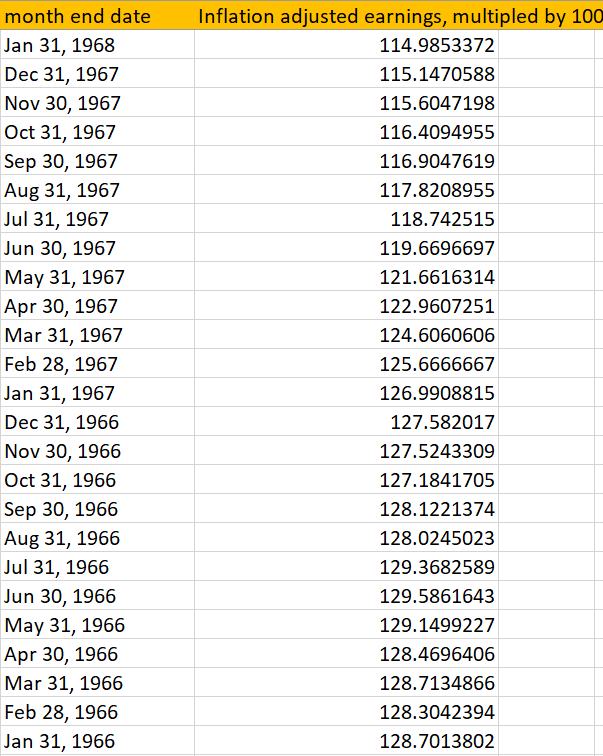
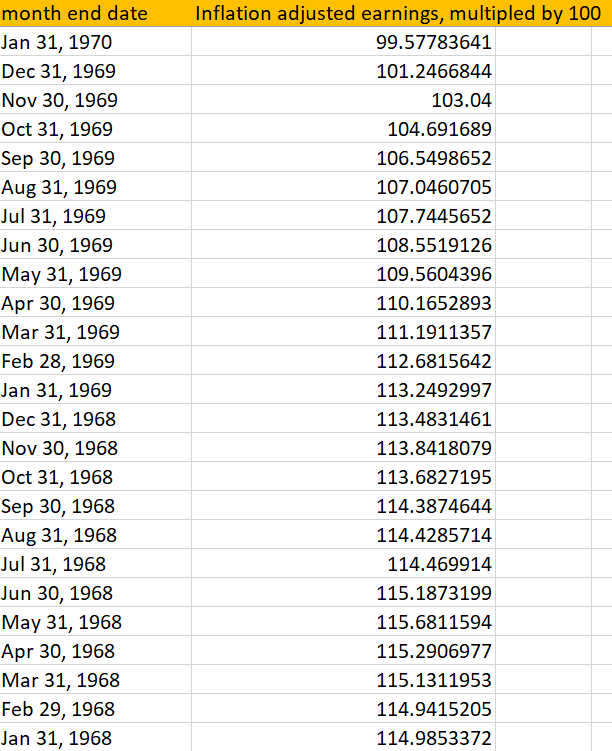
1968-1970
This was an interesting case. Inflation-adjusted earnings peaked almost 2.5 years before the bull market peaked in late-1968. (Earnings peaked in January 1966). This was a leading indicator, but it led the bear market by TOO MUCH.
*Inflation adjusted earnings peaked in mid-1966
Conclusion
Corporate earnings don’t seem to be a consistently accurate leading indicator for the stock market. It doesn’t really matter if you adjust it for inflation or not (although adjusting it for inflation clearly does make it more useful).
- Sometimes earnings peak before the stock market peaks (leading).
- Sometimes earnings peak while the stock market peaks (coincident).
- Sometimes earnings peak after the stock market peaks (lagging).
That’s for stock market tops. Corporate earnings aren’t a leading indicator for stock market bottoms either.
- Sometimes earnings bottom before the stock market bottoms.
- Sometimes earnings bottom while the stock market bottoms.
- Sometimes earnings bottom after the stock market bottoms.
Here are some examples.
Corporate earnings don’t consistently lead stock market bottoms
Here are the 2007-2009 and 2000-2002 bear markets.
- Earnings and the stock market bottomed together in early-2009. Coincident indicator.
- Earnings bottomed in October 2001, almost a year before the stock market bottomed in September 2002. Leading indicator (but leading by too much).
Here’s the 20% “significant correction” of 1990. The stock market bottomed in 1990, but non-inflation adjusted earnings bottomed in October 1991. Lagging indicator.
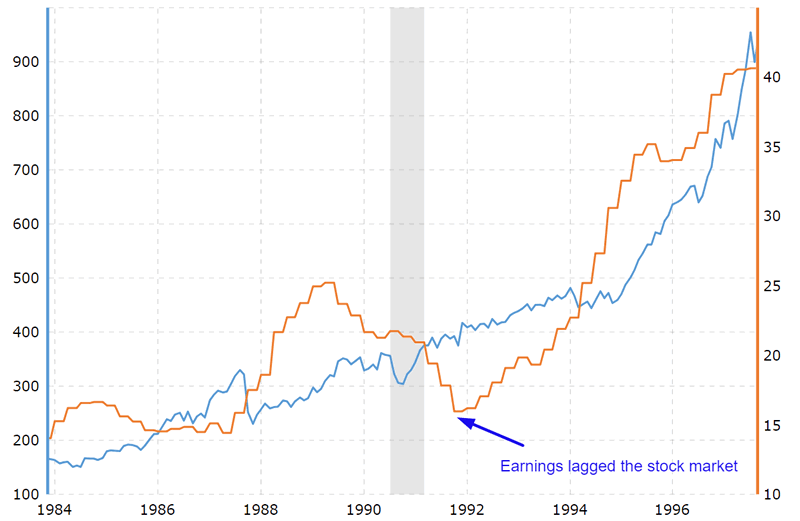
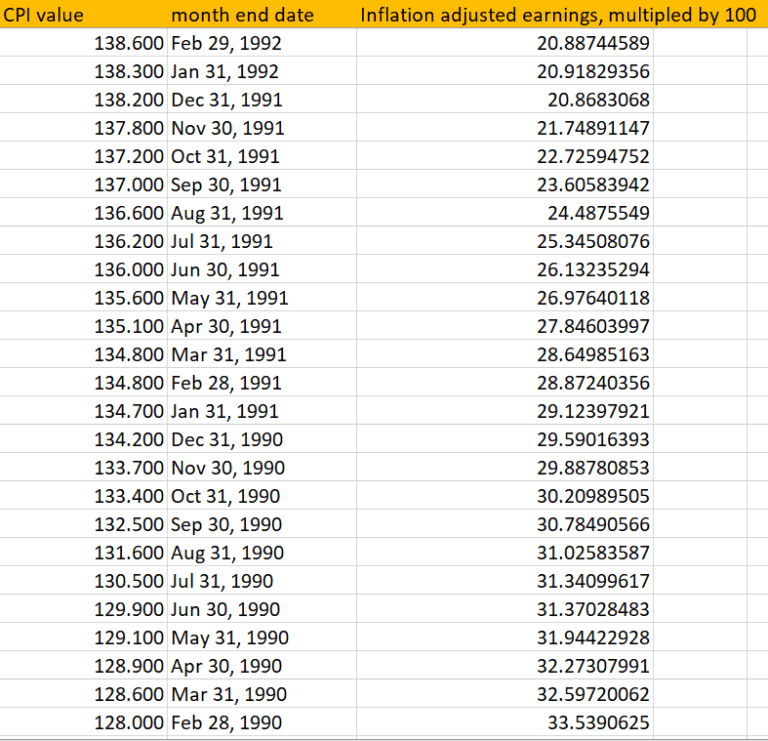
This problem becomes even worse when you adjust earnings for inflation. Inflation-adjusted earnings bottomed in December 1991.
I’m not going to use earnings in the Medium-Long Term Model or other trading models for the time being. I’m not quite sure how to use earnings to predict the stock market. Maybe I’ll come back to this in the future.
Economic data is more useful for predicting the stock market’s medium-long term future than corporate earnings.
What do you guys think? How do you use corporate earnings to trade the stock market?
By Troy Bombardia
I’m Troy Bombardia, the author behind BullMarkets.co. I used to run a hedge fund, but closed it due to a major health scare. I am now enjoying life and simply investing/trading my own account. I focus on long term performance and ignore short term performance.
Copyright 2018 © Troy Bombardia - All Rights Reserved
Disclaimer: The above is a matter of opinion provided for general information purposes only and is not intended as investment advice. Information and analysis above are derived from sources and utilising methods believed to be reliable, but we cannot accept responsibility for any losses you may incur as a result of this analysis. Individuals should consult with their personal financial advisors.
© 2005-2022 http://www.MarketOracle.co.uk - The Market Oracle is a FREE Daily Financial Markets Analysis & Forecasting online publication.