


Stock Market Golden/Death Cross Model that Yields 16% per year
Stock-Markets / Stock Markets 2018 May 06, 2018 - 01:57 PM GMTBy: Troy_Bombardia

 So far I’ve shown you 2 simple trading models that use 1 indicator per model: a Golden/Death Cross model and an Initial Claims model.
Here’s the beauty. When you combine 2 simple ideas and models together, you make it even better. Remember, I said traders who combine fundamentals with technicals perform the best.
Here’s the new model. It’s based off of the Golden/Death Cross Model, but it’s combined with an Initial Claims filter.
BUY indicator
- Indicator: Buy SSO when the S&P 500 makes a “golden cross”, AND… the 50sma remains above its 200sma for 5 consecutive trading days (in other words, the S&P made a “golden cross” 5 days ago).
Position size: 100% long
*”Golden cross” is when the S&P 500’s 50 daily moving average rises above its 200 daily moving average.
*SSO is the S&P 500’s 2x leveraged ETF.
SELL indicators
Only SELL your SSO if both of these indicators occur:
- Indicator 1: When the S&P 500 makes a “death cross”, AND…
- Indicator 2: Initial Claims is above its 52 week (1 year) moving average for 8 consecutive weeks (2 months).
Position size: when you sell, shift to 100% cash.
*A “death cross” occurs when the S&P 500’s 50 daily moving average crosses below its 200 daily moving average.
Rationale behind the Initial Claims filter
As you can see, the basis of this trading model is still the Golden/Death Cross. The Initial Claims filter helps the Golden/Death Cross model with its main disadvantage. I said on the Golden/Death Cross Model’s page:
- This Golden/Death Cross Model underperforms “buy and hold” during a bull market because you miss out on some parts of the bull market. (Remember what the study said: the “death cross” is more often a bullish sign than a bearish sign during a bear market).
- This Golden/Death Cross Model outperforms buy and hold during a bear market because you sit in cash while “buy and hold” gets clobbered.
In other words, if you can avoid selling when it’s a bull market, then your performance will improve. The Initial Claims filter cuts down on the Golden/Death Cross’ false signals. These false signals often resulted in the trader selling and then buying back at a higher price.
The economy and the stock market move in the same direction over the long run. This means that Initial Claims is used by this model to confirm the SELL signal from the Death Cross. The Death Cross is a technical indicator. Initial Claims is the fundamental confirmation indicator.
You can see in the following chart how Initial Claims go up during recessions and equities bear markets. It confirms the bear market in stocks. (Equities bear markets are driven by deteriorating fundamentals.)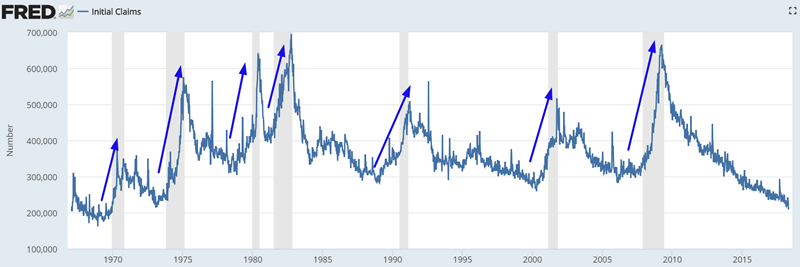
Historical results for this model
- Buying and holding a 2x leveraged ETF like SSO from 1950-present yields an average of 13.2% per year.
- The Golden/Death Cross Model on its own from 1950-present yields an average of 14% per year.
- This Golden/Death Cross Model with Initial Claims Filter from 1950-present yields an average of 16% per year.
Notice how the performance improves? Initial Claims data started in 1967, which means that the Initial Claims filter has only been able to improve the Golden/Death Cross Model since 1967. If Initial Claims data had existed from 1950-1967, this new model’s performance would probably improve even more.
That’s why in the next model we’re going to look at what happens when you use the Golden/Death Cross Model with the Unemployment Rate as a filter. Unemployment Rate data goes back to 1948, which covers the S&P 500 from 1950-present. The Unemployment Rate and Initial Claims move in sync, but there is more data on the Unemployment Rate.
What’s good about this model
This new and improved model yields an average of 16% per year. It isn’t massively better than just buying and holding a 2x leveraged ETF like SSO (approximately 13.2% per year).
What makes this model very good is that it’s results are rather consistent. It avoids large drawdowns that occur when you buy and hold.
Here are the BUY and SELL dates/prices.
Click here to download the data and backtesting for this model in Excel.
I will show readers in the membership program how to make this model even better.
| Buy date | hypothetical SSO | Sell date | hypothetical SSO sell $ | % profit |
| 29/06/2009 | 12428.12 | present | 83281.9 | 6.701085925 |
| 20/05/2003 | 16502.02 | 21/12/2007 | 40129.21 | 2.431775625 |
| 22/02/1991 | 3704.32 | 21/11/2000 | 40641.85 | 10.97147385 |
| 1/06/1990 | 3740.56 | 7/09/1990 | 2940.21 | 0.786034711 |
| 4/10/1982 | 545.73 | 26/02/1990 | 3074.22 | 5.633225221 |
| 23/06/1980 | 510.08 | 22/09/1981 | 515.8 | 1.011213927 |
| 27/03/1979 | 417.97 | 22/04/1980 | 417.2 | 0.998157763 |
| 12/03/1975 | 294.16 | 9/01/1979 | 393.57 | 1.337945336 |
| 28/10/1970 | 323.15 | 11/09/1973 | 479 | 1.482283769 |
| 3/06/1969 | 503.23 | 23/06/1969 | 442.17 | 0.878663832 |
| 23/05/1968 | 451.89 | 13/03/1969 | 463.09 | 1.024784793 |
| 9/02/1967 | 370.81 | 27/02/1968 | 395.24 | 1.065882797 |
| 23/09/1965 | 398.5 | 28/04/1966 | 408.82 | 1.025897114 |
| 9/01/1963 | 208.77 | 22/07/1965 | 347.13 | 1.662738899 |
| 10/01/1961 | 180.8 | 7/05/1962 | 223.82 | 1.237942478 |
| 6/01/1960 | 190.07 | 15/02/1960 | 159.75 | 0.840479823 |
| 14/05/1958 | 99.16 | 30/10/1959 | 174.08 | 1.755546591 |
| 7/06/1957 | 124.15 | 26/09/1957 | 97.82 | 0.787917841 |
| 28/12/1953 | 34.88 | 26/10/1956 | 116.82 | 3.349197248 |
| 22/03/1950 | 18.45 | 11/05/1953 | 35.62 | 1.930623306 |
By Troy Bombardia
I’m Troy Bombardia, the author behind BullMarkets.co. I used to run a hedge fund, but closed it due to a major health scare. I am now enjoying life and simply investing/trading my own account. I focus on long term performance and ignore short term performance.
Copyright 2018 © Troy Bombardia - All Rights Reserved
Disclaimer: The above is a matter of opinion provided for general information purposes only and is not intended as investment advice. Information and analysis above are derived from sources and utilising methods believed to be reliable, but we cannot accept responsibility for any losses you may incur as a result of this analysis. Individuals should consult with their personal financial advisors.
© 2005-2022 http://www.MarketOracle.co.uk - The Market Oracle is a FREE Daily Financial Markets Analysis & Forecasting online publication.