


Stock Market “Sell in May and go away” Study When Stocks Are Down YTD
Stock-Markets / Stock Markets 2018 May 03, 2018 - 03:20 PM GMTBy: Troy_Bombardia

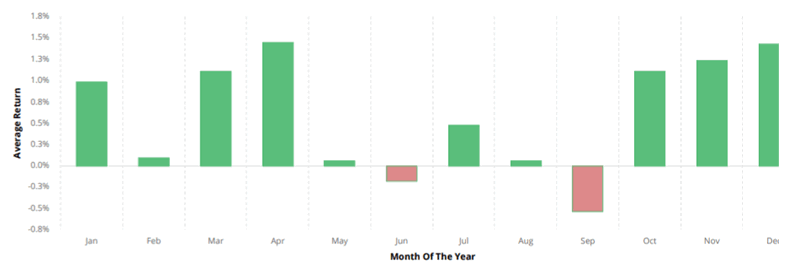
 As you probably know, “Sell in May and go away’ states that the stock market is seasonally weak from May – September. We already demonstrated that it isn’t as weak as investors think in this study.
Some investors believe that May-September is not seasonally bearish IF…
- The stock market falls from January – April, AND…
- There’s no recession that year (a recession in 2018 is highly unlikely).
Are they right? Let’s look at what happens next to the U.S. stock market from May-September when
The S&P falls from January – April…
And the S&P isn’t in a recession that year (a recession in 2018 is highly unlikely)
Here are the historical years.
- 2018 (present case)
- 2005
- 2004
- 2002
- 2000
- 1994
- 1992
- 1984
- 1977
- 1966
- 1962
- 1952
Here’s what happened next
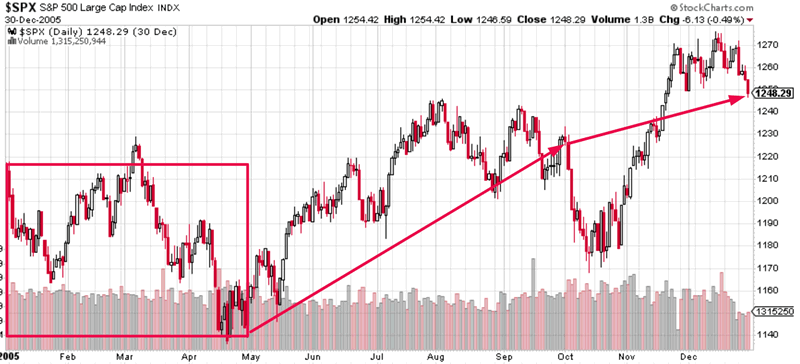
2005
The stock market went up from May-September. It also went up from October – December.
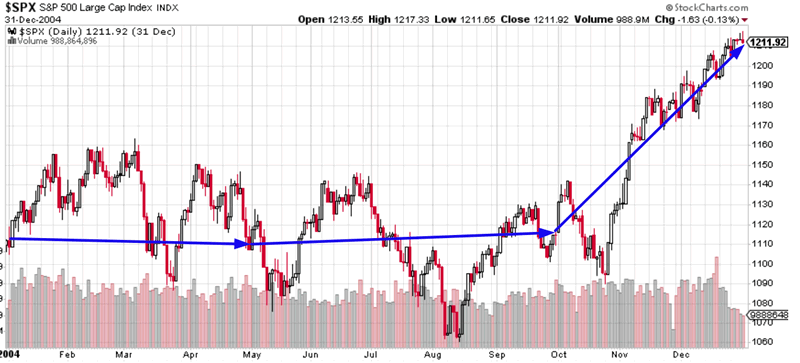
2004
The stock market was flat from May-September. It went up from October – December.
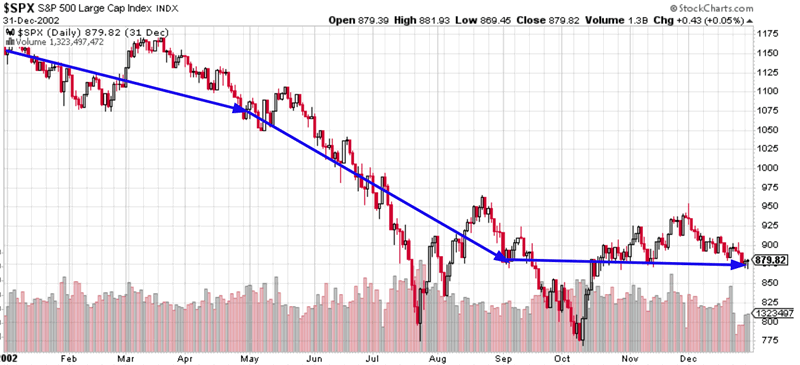
2002
The stock market went down from May-September. It also went down from October – December.
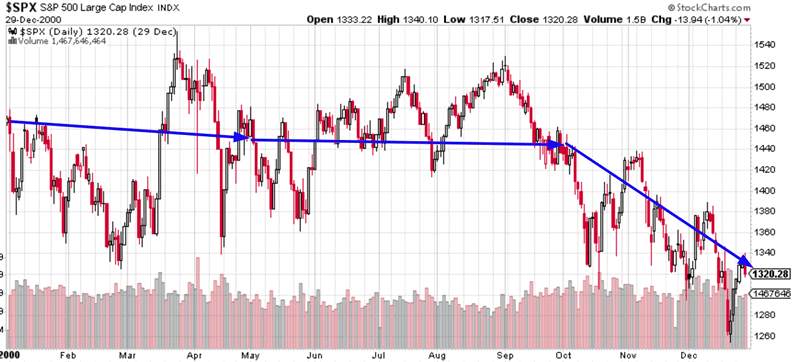
2000
The stock market was flat from May-September. It went down from October – December.
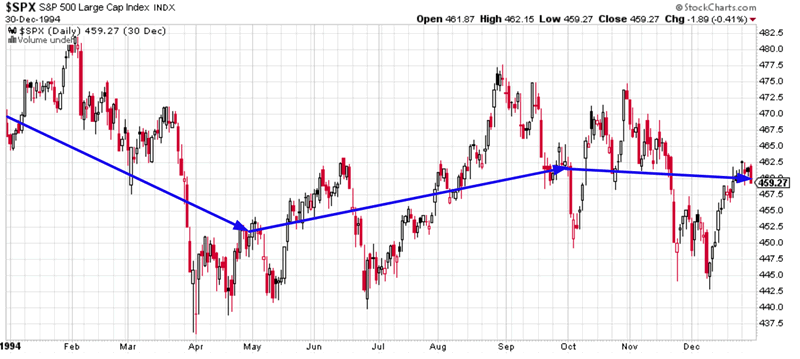
1994
The stock market went up from May-September. It was flat from October – December.
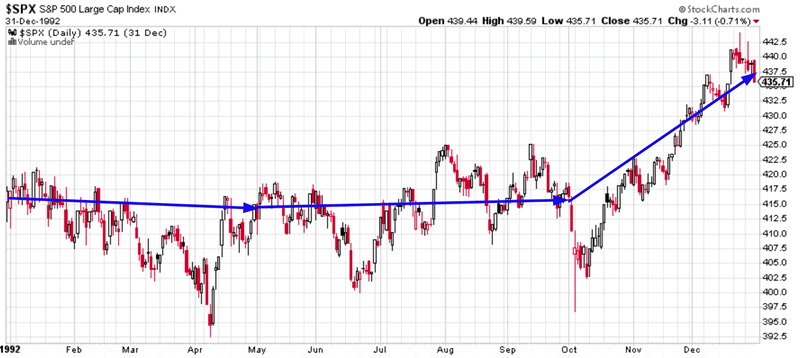
1992
The stock market was flat from May-September. It went up from October – December.
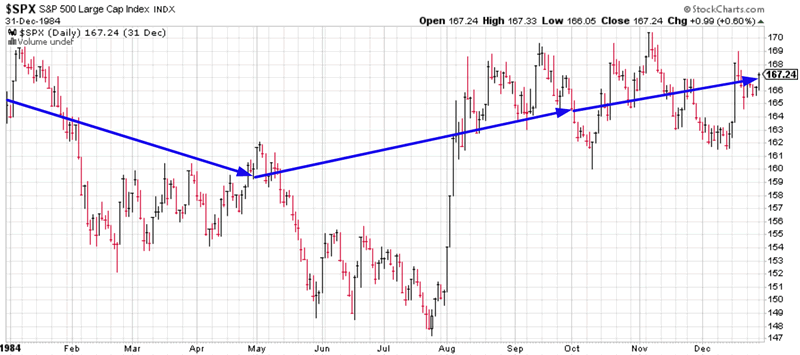
1984
The stock market went up from May-September. It also went up from October – December.
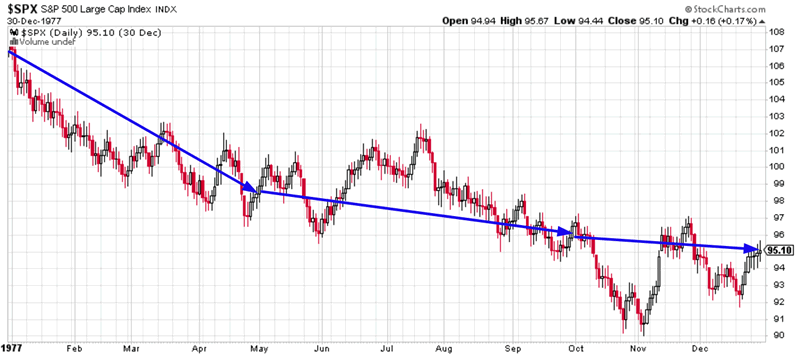
1977
The stock market went down from May-September. It also went down from October – December.
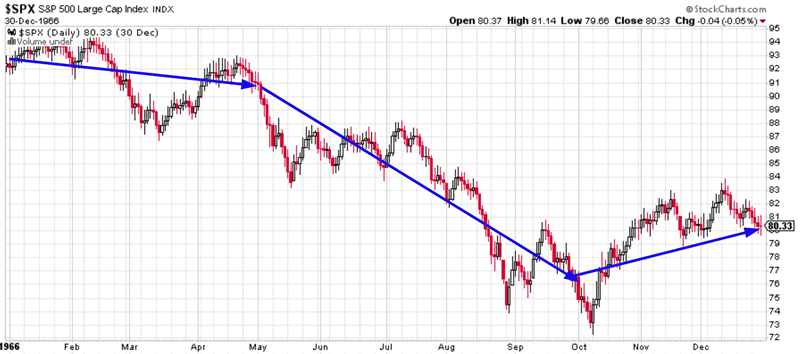
1966
The stock market went down from May-September. It went up from October – December.
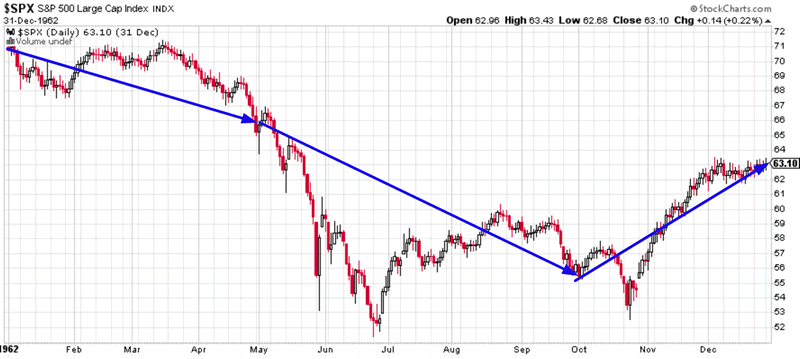
1962
The stock market went down from May-September. It went up from October – December.
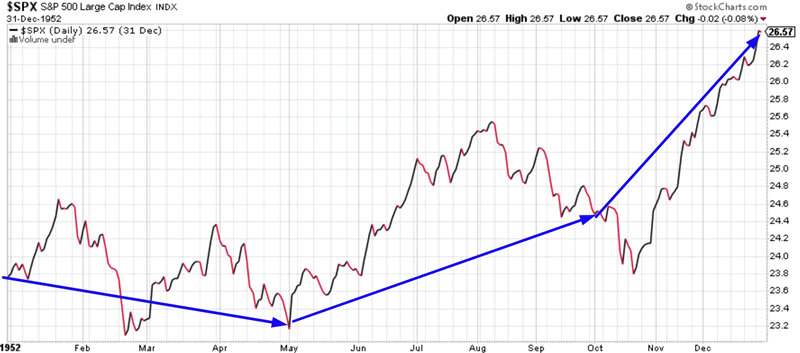
1952
The stock market went up from May-September. It also went up from October – December.
Conclusion
From May-September:
- 4 cases went up
- 3 cases were flat
- 4 cases where down
From October – December:
- 7 cases were up
- 1 case was flat
- 3 cases were down
As you can see, “sell in May and go away” is neither consistently bearish nor bearish. It’s random. The probability of the stock market going up from May-September = the probability of the market going down from May-September. It doesn’t matter what the S&P was doing from January – April.
By Troy Bombardia
I’m Troy Bombardia, the author behind BullMarkets.co. I used to run a hedge fund, but closed it due to a major health scare. I am now enjoying life and simply investing/trading my own account. I focus on long term performance and ignore short term performance.
Copyright 2018 © Troy Bombardia - All Rights Reserved
Disclaimer: The above is a matter of opinion provided for general information purposes only and is not intended as investment advice. Information and analysis above are derived from sources and utilising methods believed to be reliable, but we cannot accept responsibility for any losses you may incur as a result of this analysis. Individuals should consult with their personal financial advisors.
© 2005-2022 http://www.MarketOracle.co.uk - The Market Oracle is a FREE Daily Financial Markets Analysis & Forecasting online publication.