Global Stock Markets “Turn-of-the-Month” Effect Returns Analysis
Stock-Markets / Stock Markets 2018 May 03, 2018 - 11:41 AM GMTBy: Dimitri_Speck
 In Other Global Markets the “Turn-of-the-Month” Effect Generates Even Bigger Returns than in the US
Dear Investor,
the “turn-of-the-month” effect is one of the most fascinating stock market phenomena.
It describes the fact that price gains primarily tend to occur around the turn of the month. By contrast, the rest of the time around the middle of the month is typically less profitable for investors.
The effect has been examined extensively in the US market. In the last issue of Seasonal Insights I have shown the extent of the “turn-of-the-month” effect in the eleven largest international stock markets.
The result was that overseas markets also tend to be significantly stronger around the turn of the month than around the middle of the month – in all the countries under review the effect was even more pronounced than in the US!
The turn-of-the-month pattern in 11 countries
The following charts show the cumulative returns achieved over time in all eleven countries around the turn of the month (blue lines) and around the middle of the month (red lines).
I have measured the average return of investing in these indexes in the time period from the 26th of each month to the 5th of the subsequent month, i.e., over a period of slightly less than two weeks around the turn of the month. Then I compared this return with that achieved by investing during the rest of the time around the middle of the month, i.e., from the 6th to the 25th of each month.
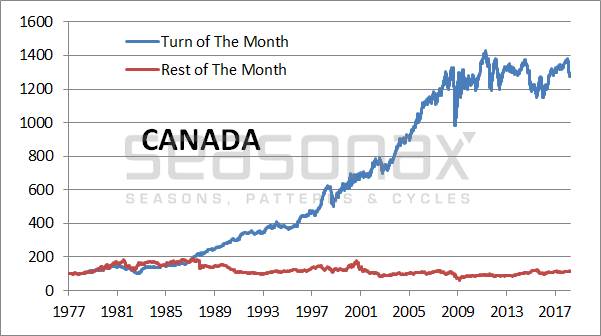
Canada: Cumulative return around the turn of the month (blue line) and over the rest of the time (red line), indexed (100)
The returns of turn-of-the-month period clearly beat those achieved around the middle of the month!
Source: Seasonax
China: Cumulative return around the turn of the month (blue line) and over the rest of the time (red line), indexed (100)
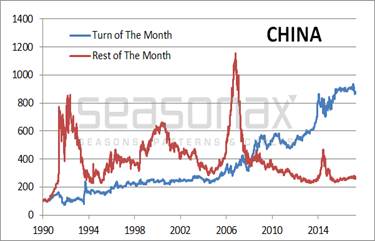
The mid-month period only scores in bull markets
Source: Seasonax
France: Cumulative return around the turn of the month (blue line) and over the rest of the time (red line), indexed (100)
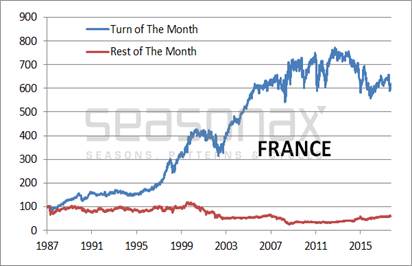
The mid-month period sags
Source: Seasonax
Germany: Cumulative return around the turn of the month (blue line) and over the rest of the time (red line), indexed (100)
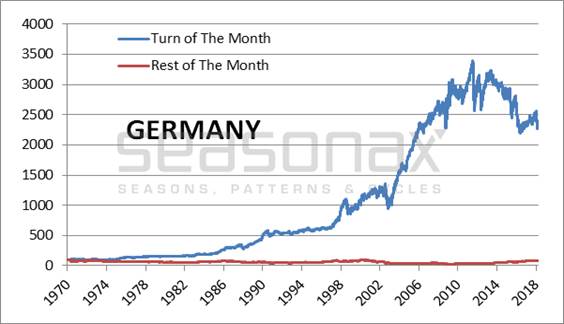
The mid-month period is barely visible on the chart
Source: Seasonax
Hong Kong: Cumulative return around the turn of the month (blue line) and over the rest of the time (red line), indexed (100)
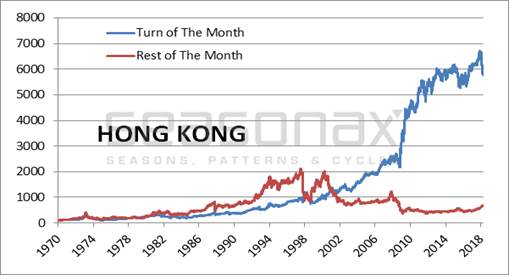
The mid-month period outperformed only temporarily
Source: Seasonax
India: Cumulative return around the turn of the month (blue line) and over the rest of the time (red line), indexed (100)
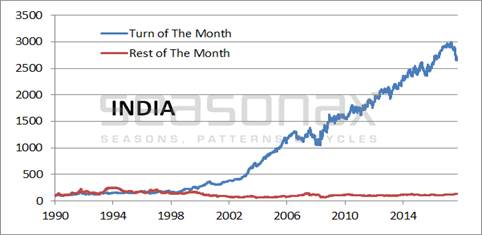
The turn-of-the-month period has been leading for years
Source: Seasonax
Japan: Cumulative return around the turn of the month (blue line) and over the rest of the time (red line), indexed (100)
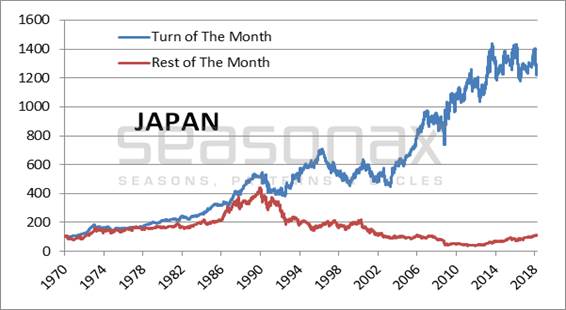
In Japan the market's turn-of-the-month performance is noticeably stronger as well
Source: Seasonax
Korea: Cumulative return around the turn of the month (blue line) and over the rest of the time (red line), indexed (100)
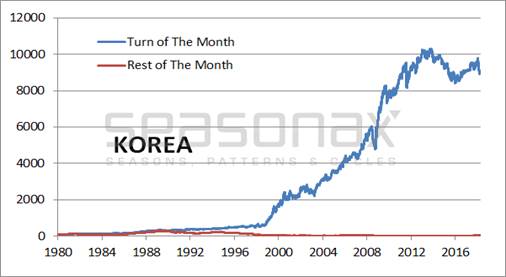
It seems the mid-month period is trying to hide (it is probably ashamed)
Source: Seasonax
Taiwan: Cumulative return around the turn of the month (blue line) and over the rest of the time (red line), indexed (100)
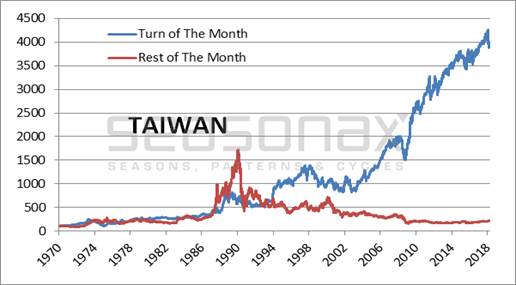
In Taiwan's stock market the turn-of-the-month period also beats the mid-month period hands-down
Source: Seasonax
Great Britain: Cumulative return around the turn of the month (blue line) and over the rest of the time (red line), indexed (100)
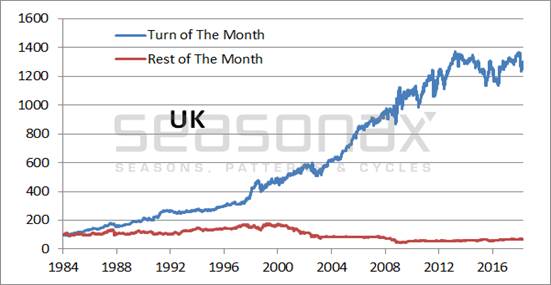
The turn-of-the-month period outperforms steadily
Source: Seasonax
US: Cumulative return around the turn of the month (blue line) and over the rest of the time (red line), indexed (100)
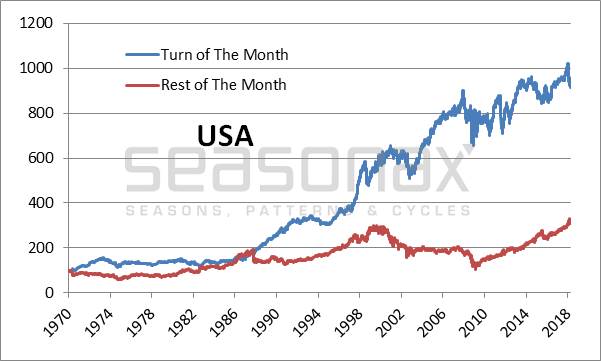
Funny enough, of all markets the US market exhibits the smallest difference between the returns achieved in the two time periods
Source: Seasonax
As you can see, stock market investments generate significantly larger gains around the turn-of-the-month than around the middle of the month all over the world. Clearly this is a globally relevant phenomenon.
The turn-of-the-month effect is even more pronounced in overseas markets than in the US
Below I once again show you a table detailing the returns of the turn-of-the-month period compared to those achieved in the mid-month period in the eleven countries under review.
Turn-of-the-month effect in selected countries
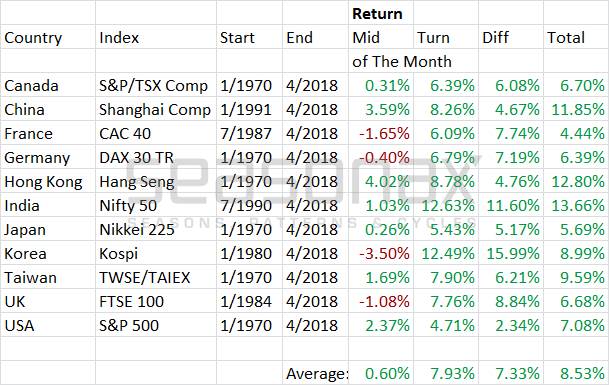
The turn-of-the-month period clearly outperformed the mid-month period in all eleven countries.
Source: Seasonax
The column designated “Diff” shows the excess return of the turn-of-the-month period over the mid-month period. As a glance at this column immediately makes clear, the gains achieved by investing in the turn-of-the-month period are beating those of the mid-month period in all eleven countries, in most cases by quite a significant amount! These excess returns are achieved despite the fact that the time period during which the turn-of-the-month effect occurs is actually slightly shorter.
As the table illustrates, the strength exhibited by the stock market around the turn of the month is a global phenomenon. This is a very simple pattern. There exist a great many more seasonal patterns, which can be identified with the Seasonax app on Bloomberg and/or Thomson-Reuters. Many of these patterns are still completely unknown – and potentially offer even more substantial outperformance.
Yours sincerely,
Dimitri Speck
Founder of Seasonax and Head Analyst 90 Tage Trader
PS: With the Seasonax event tool you can create your own event studies!
© 2018 Copyright Dimitri Speck - All Rights Reserved - Disclaimer: The above is a matter of opinion provided for general information purposes only and is not intended as investment advice. Information and analysis above are derived from sources and utilising methods believed to be reliable, but we cannot accept responsibility for any losses you may incur as a result of this analysis. Individuals should consult with their personal financial advisors.
© 2005-2022 http://www.MarketOracle.co.uk - The Market Oracle is a FREE Daily Financial Markets Analysis & Forecasting online publication.


