


Why Stock Market Death Crosses Aren’t Bearish
InvestorEducation / Technical Analysis Apr 29, 2018 - 10:40 AM GMTBy: Troy_Bombardia

 Here at Bull Markets I try to dispel conventional trading “wisdom” that’s widely accepted but is false. The media’s repetition of these statements misleads traders and investors.
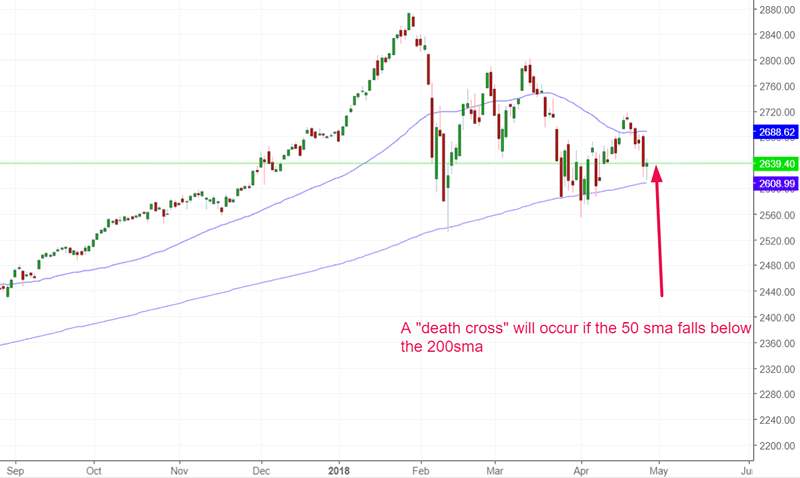
I’ve recently heard some chatter about the “death cross” because the stock market has been falling a little. For those who aren’t aware, the “death cross” occurs when the 50 daily moving average falls below the 200 daily moving average. This is seen by mainstream financial media is a BIG bearish signal.
It isn’t.
Historically, the death cross has always happened during the initial 1/5 of a bear market. That makes sense. The death cross is a trend following indicator, which means that it will scream SELL during the initial 1/5 of a bear market.
However, the death cross has TOO MANY false signals. It is actually more often a medium-long term bullish signal than a bearish signal. Here are all the S&P 500’s death crosses that have occurred over the past 20 years. Extended the data to 1950 gives you the same conclusion: the death cross is not consistently bearish for the stock market. It isn’t a useful indicator.
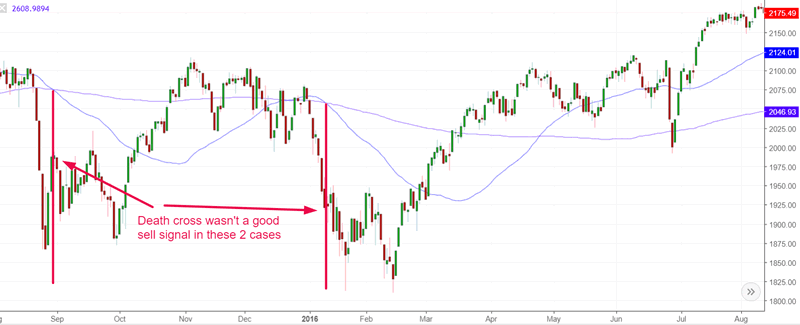
2015-2016 death crosses
The death cross occurred AFTER the market had already crashed in this “significant correction”. Both times it occurred towards the bottom of the “significant correction”. It was a terrible medium-long term SELL signal. (S&P 500 soared throughout 2016-2017).
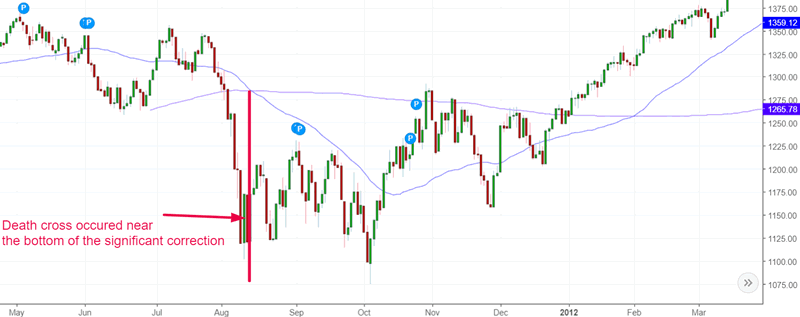
2011 death cross
The death cross occurred near the bottom of the “significant correction”. It was a terrible medium-long term SELL signal. In fact, this was the time to buy stocks.
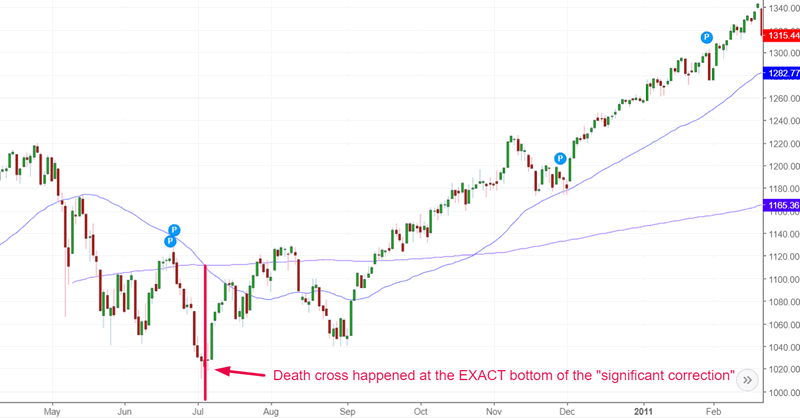
2010 death cross
The death cross occurred near the exact bottom of the “significant correction”. It was a terrible medium-long term SELL signal. In fact, this was the time to buy stocks. The stock market soared over the next half year.
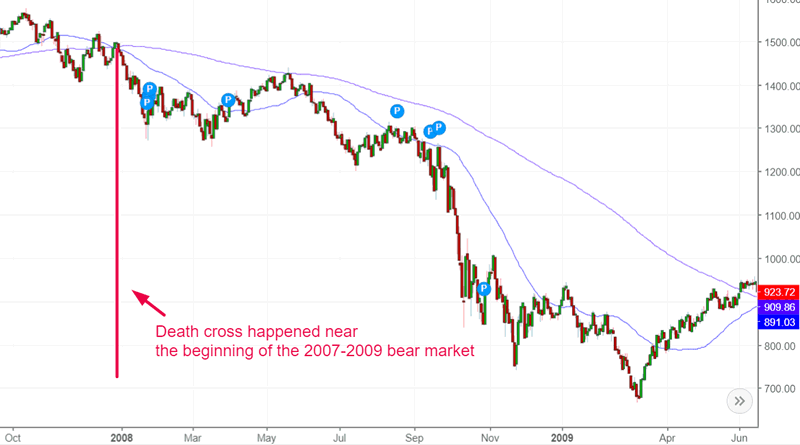
2007 death cross
The death cross occurred in the initial stages of the 2007-2009 bear market. Traders who used the “death cross” would have been able to avoid most of the bear market.
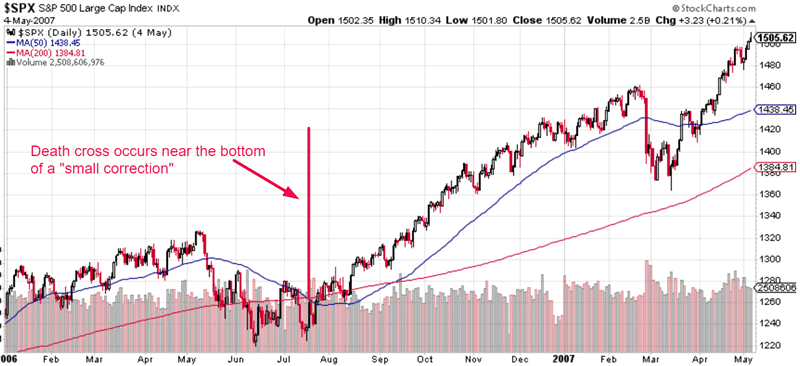
2006 death cross
The death cross occurred near the bottom of the “small correction”. It was a terrible medium-long term SELL signal. In fact, this was the time to buy stocks. The stock market soared over the next half year.
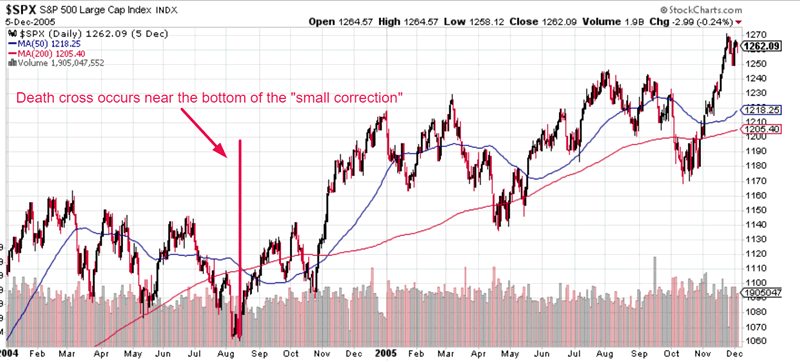
2004 death cross
The death cross occurred near the bottom of the “small correction”. It was a terrible medium-long term SELL signal. In fact, this was the time to buy stocks.
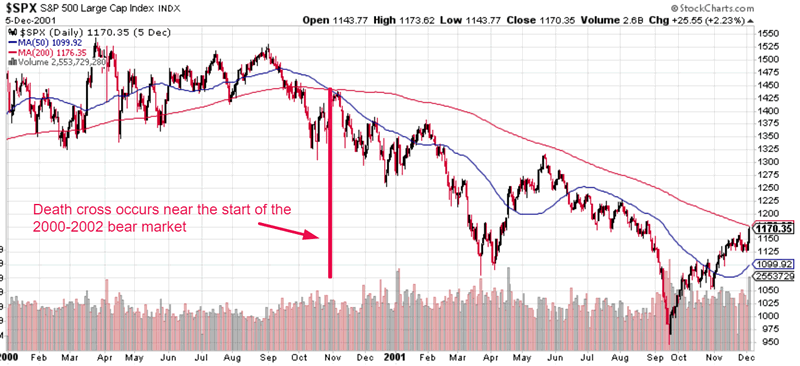
2000 death cross
The death cross occurred near the start of the 2000-2002 bear market. In this case it was a timely SELL signal.
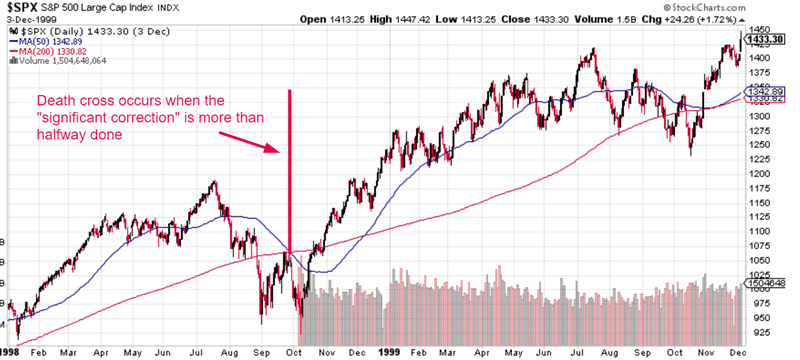
1998 death cross
The death cross occurred AFTER the stock market had already crashed in this “significant correction”. It came out during the post-crash retest wave. It was a terrible medium-long term SELL signal. In fact, this was the time to buy stocks. The stock market soared throughout the rest of 1998-1999.
Conclusion
As you can see, the “death cross” is neither bullish nor bearish. It just is. It’s like stating a fact (the 50 daily moving average has crossed below the 200 daily moving average).
Death crosses can be used to get out of harms way during a bear market. But they are BULLISH signals during a bull market (when the signal comes out during a “significant correction” or “small correction). It doesn’t tell you anything about whether this is a bull or bear market.
Remember, technical analysis on its own doesn’t work that well in the stock market. You have to combine technical analysis with fundamental analysis.
By Troy Bombardia
I’m Troy Bombardia, the author behind BullMarkets.co. I used to run a hedge fund, but closed it due to a major health scare. I am now enjoying life and simply investing/trading my own account. I focus on long term performance and ignore short term performance.
Copyright 2018 © Troy Bombardia - All Rights Reserved
Disclaimer: The above is a matter of opinion provided for general information purposes only and is not intended as investment advice. Information and analysis above are derived from sources and utilising methods believed to be reliable, but we cannot accept responsibility for any losses you may incur as a result of this analysis. Individuals should consult with their personal financial advisors.
Troy Bombardia Archive |
© 2005-2022 http://www.MarketOracle.co.uk - The Market Oracle is a FREE Daily Financial Markets Analysis & Forecasting online publication.