


Breadth Study Suggests that Stock Market Bottom is Already In
Stock-Markets / Stock Markets 2018 Apr 19, 2018 - 03:14 PM GMTBy: Troy_Bombardia

 Last week we demonstrated a momentum+breadth study which supported the medium term bullish case for the stock market.
Now let’s look at the short term case for the stock market. Is the stock market’s EXACT bottom already in?
The NYSE cumulative Advance-Decline Line (one of the best breadth indicators) just made a new all-time high yesterday while the S&P 500 has yet to make a new high.
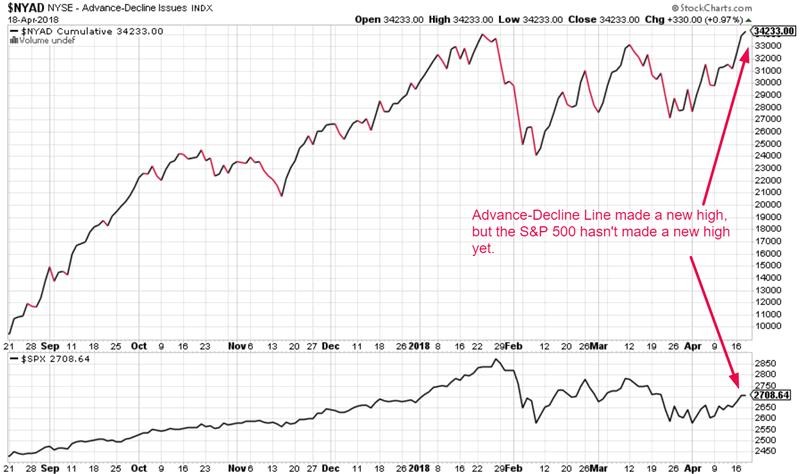
Charts courtesy StockCharts.com
What happens historically when:
- The S&P 500 makes a 10%+ “small correction”, and….
- The Advance-Decline Line makes a new high?
Is the S&P 500’s exact bottom already in? Here are the historical cases (based on correction start dates):
- April 2, 2012
- July 16, 2007
- January 3, 2000
- July 19, 1999
- October 7, 1997
- February 19, 1997
- May 23, 1996
- January 3, 1990
- August 27, 1986
- September 25, 1967
- May 13, 1965
- September 23, 1955
Let’s look at these historical cases in detail.
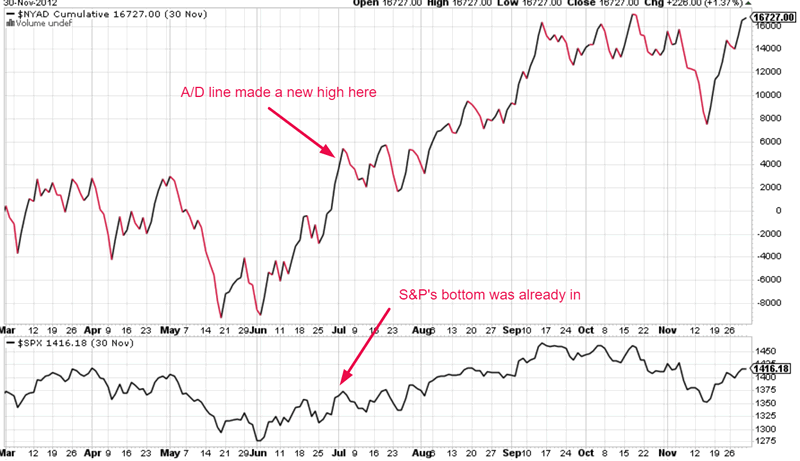
April 2, 2012
The Advance-Decline line made a new all-time high before the S&P did. The S&P did not make a lower low after the A/D line made new highs.
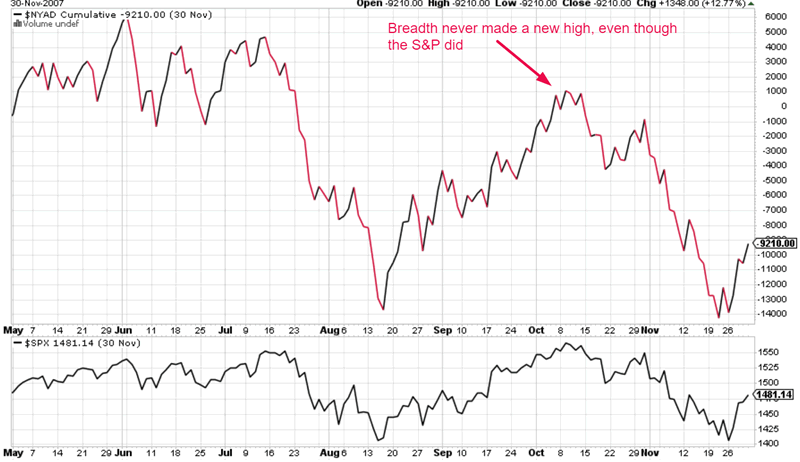
July 16, 2007
The S&P 500 made a new high before the A/D line did. The A/D line did not go on to make a new high.
This historical case does not apply to today because the A/D line has already made a new high.
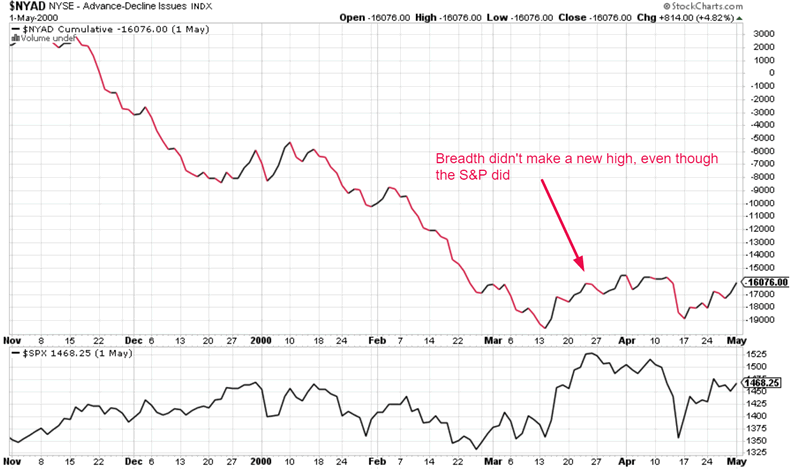
January 3, 2000
The S&P 500 made a new high before the A/D line did. The A/D line did not go on to make a new high.
This historical case does not apply to today because the A/D line has already made a new high.
July 19, 1999
The S&P 500 made a new high before the A/D line did. The A/D line did not go on to make a new high.
This historical case does not apply to today because the A/D line has already made a new high.
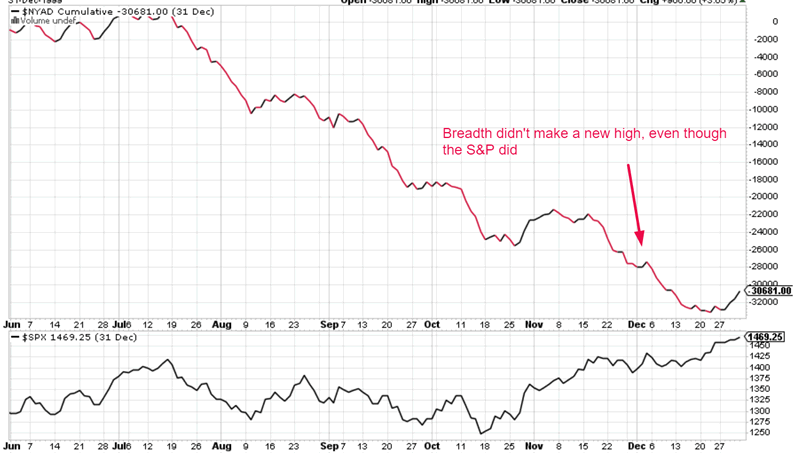
October 7, 1997
The S&P 500 made a new high before the A/D line did. This historical case does not apply to today because the A/D line has already made a new high.
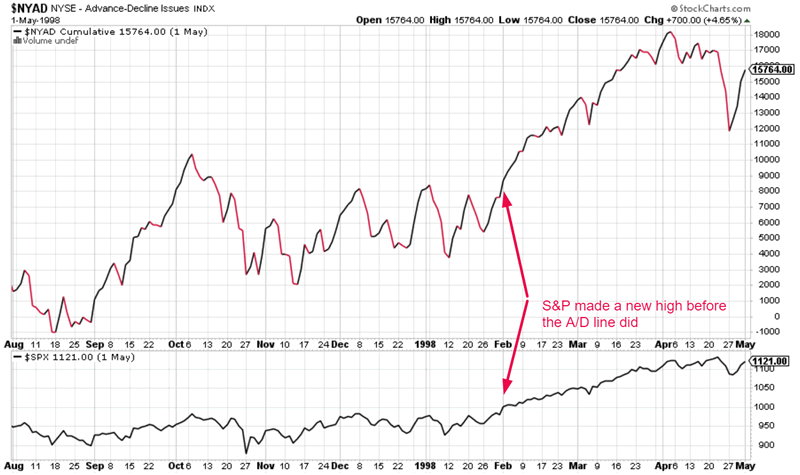
February 19, 1997
The S&P 500 made a new high before the A/D line did. This historical case does not apply to today because the A/D line has already made a new high.
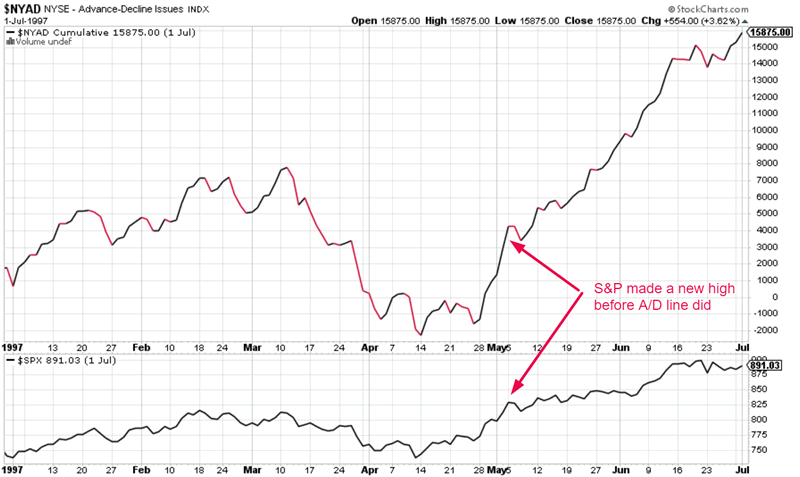
May 23, 1996
The S&P 500 made a new high before the A/D line did. This historical case does not apply to today because the A/D line has already made a new high.
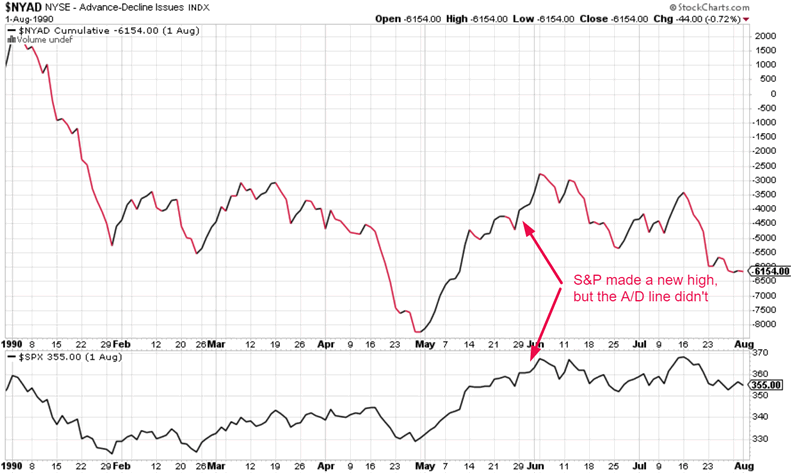
January 3, 1990
The S&P 500 made a new high before the A/D line did. The A/D line did not go on to make a new high.
This historical case does not apply to today because the A/D line has already made a new high.
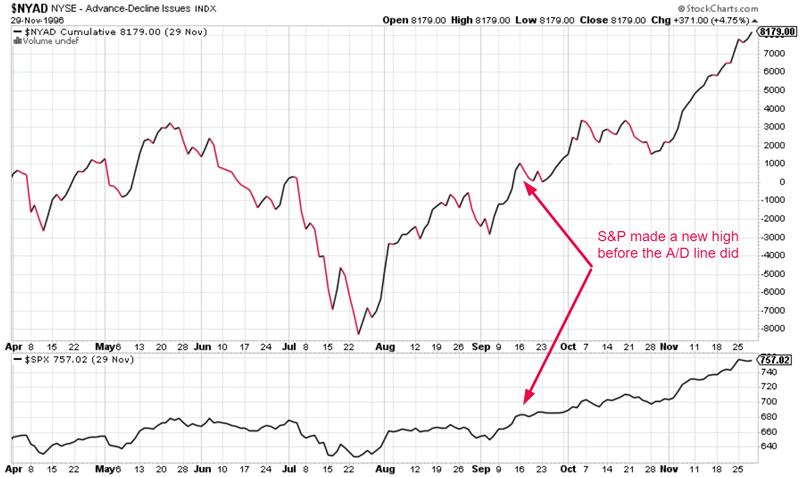
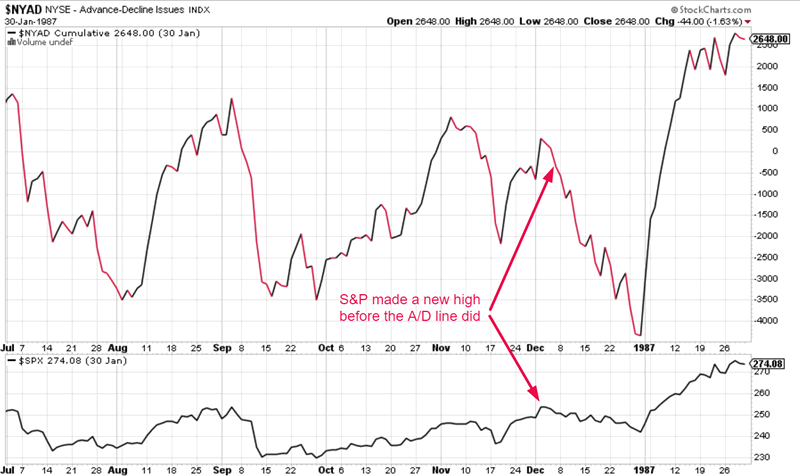
August 27, 1986
The S&P 500 made a new high before the A/D line did. This historical case does not apply to today because the A/D line has already made a new high.
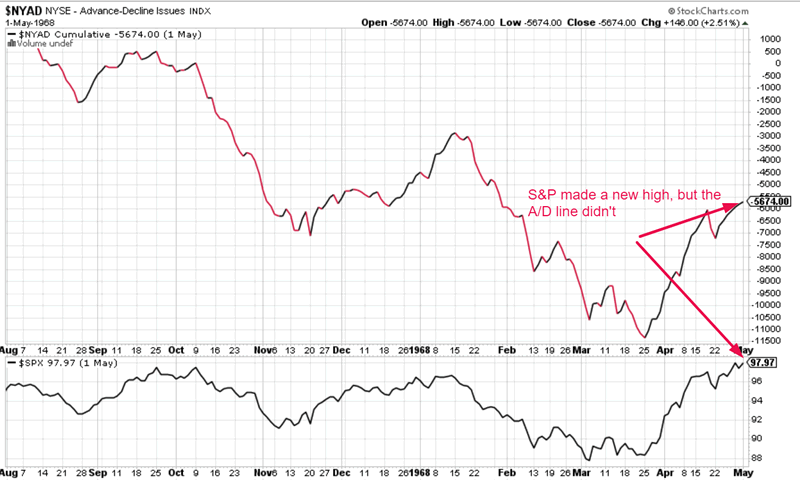
September 25, 1967
The S&P 500 made a new high before the A/D line did. The A/D line did not go on to make a new high.
This historical case does not apply to today because the A/D line has already made a new high.
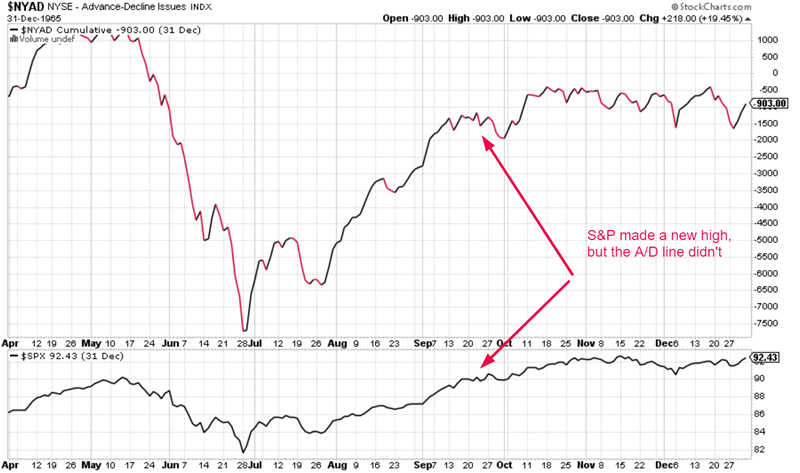
May 13, 1965
The S&P 500 made a new high before the A/D line did. The A/D line did not go on to make a new high.
This historical case does not apply to today because the A/D line has already made a new high.
September 23, 1955
The Advance-Decline line made a new all-time high before the S&P did. The S&P did not make a lower low after the A/D line made new highs.

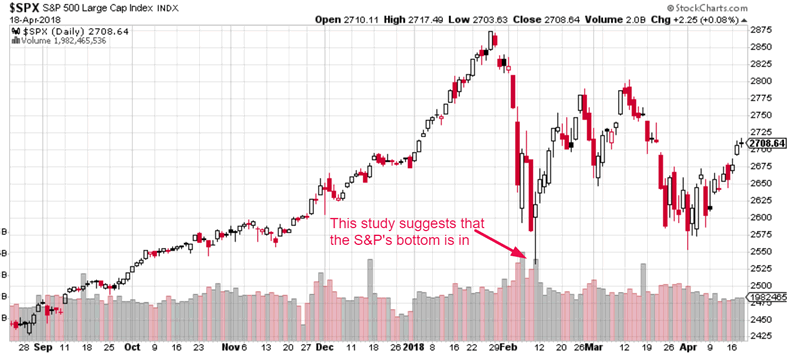
Conclusion
It is rare for the cumulative Advance-Decline line to make a new high before the S&P 500 does. Only 2 of these 12 cases saw this happen. But when this did happen, the S&P’s bottom was already in. The S&P did not go on to retest or make a lower low.
This suggests that February 9, 2018 was the bottom of this stock market correction. The bottom is already in.
By Troy Bombardia
I’m Troy Bombardia, the author behind BullMarkets.co. I used to run a hedge fund, but closed it due to a major health scare. I am now enjoying life and simply investing/trading my own account. I focus on long term performance and ignore short term performance.
Copyright 2018 © Troy Bombardia - All Rights Reserved
Disclaimer: The above is a matter of opinion provided for general information purposes only and is not intended as investment advice. Information and analysis above are derived from sources and utilising methods believed to be reliable, but we cannot accept responsibility for any losses you may incur as a result of this analysis. Individuals should consult with their personal financial advisors.
© 2005-2022 http://www.MarketOracle.co.uk - The Market Oracle is a FREE Daily Financial Markets Analysis & Forecasting online publication.