


As the Gold, Stocks, and Bond Markets Macro Turns…
Stock-Markets / Financial Markets 2018 Apr 07, 2018 - 05:02 PM GMTBy: Gary_Tanashian

 We began months ago, noting the 3 Amigos destined for their goals. Here’s a post from November 2017 explaining the macro fundamentals involved:
Updating the 3 Amigos of the Macro
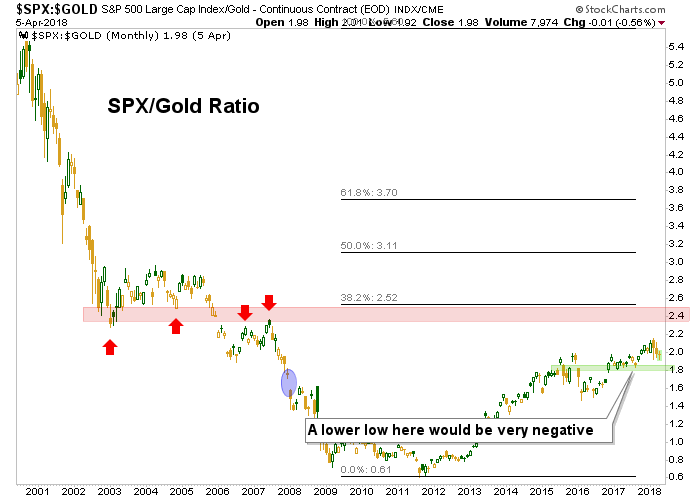
- Amigo #1 (SPX vs. Gold): Either reach major theoretical resistance (it’s a ratio, after all) or abort mission by establishing a downtrend.
- Amigo #2 (10yr yield to 2.9% and 30yr yield to 3.3%): Destinations reached!
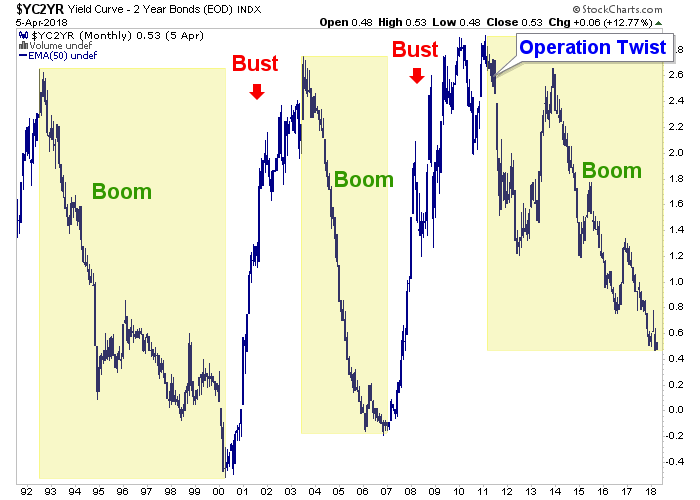
- Amigo #3 (also known as the slower, dumber Amigo, the 10yr-2yr Yield Curve): Still on his journey, flattening. The trouble would be indicated by steepening.
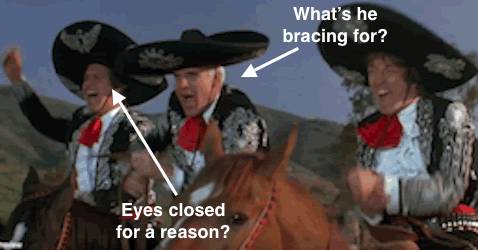
As we’ve noted, the two star Amigos (Steve Martin & Chevy Chase) were bracing for a smash against the yield Continuum ™ limiter and the conspicuous weakening of stocks vs. gold since February. The Martin Short Amigo is goofier, and on his own schedule. He’s a lesser light, after all. The two stars are making the headlines.
Beginning with Steve Martin’s character, the 30yr yield Continuum ™ hit the 100 month EMA ‘limiter’ and reversed. This does not have to be a long-term reversal. The point was for yields, which had been riding higher with stocks and risk ‘on’ assets, to hit and reverse or consolidate. What comes next is open to new analysis. We’d been expecting yields to rise to these limiters since last October and they have done so.
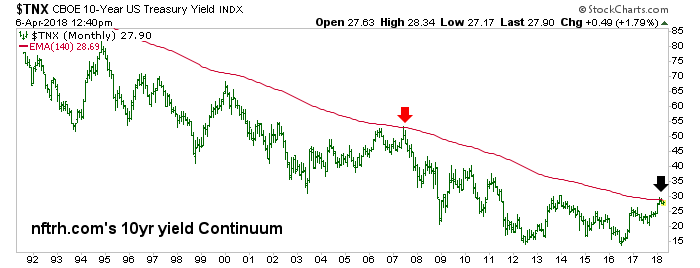
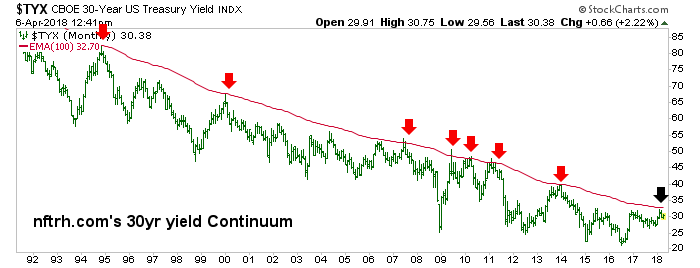
So in October and November we planned for yields to rise (bonds to decline) but in Q1 2018 as heavy hitting experts like Bill Gross, Ray Dalio and Paul Tudor Jones were proclaiming “bond bear!”right at the yield limiters while the CoT and sentiment profiles were positive for bonds, a consolidation (at least) was in the bag. Again, this indicator is now history and we move to the others.
While the major trend is still up in SPX/SPY vs. Gold/GLD, the daily view shows why Chevy Chase has his eyes closed. Amigo #1 is not painting a pretty picture in 2018. At some point this negativity would turn the long-term trend down.
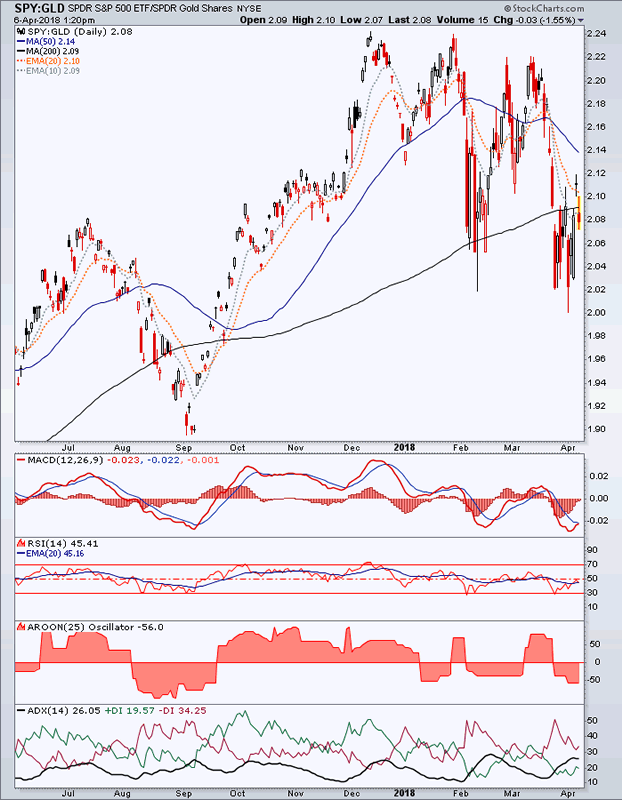
A lower low to the 2017 low in SPX/Gold would go a long way toward flipping the macro over like a capsized boat (or ship of fools, if you like).
Finally, he of the unchanging trend. The Martin Short Amigo may be the last to get the memo that the happy-go-lucky riders are destined to hit their respective walls. The yield curve continues to flatten and one day when it stops flattening and starts steepening systemic stress under pains of deflationary contraction, inflationary excess or some bizarre global mix of the two will be indicated.
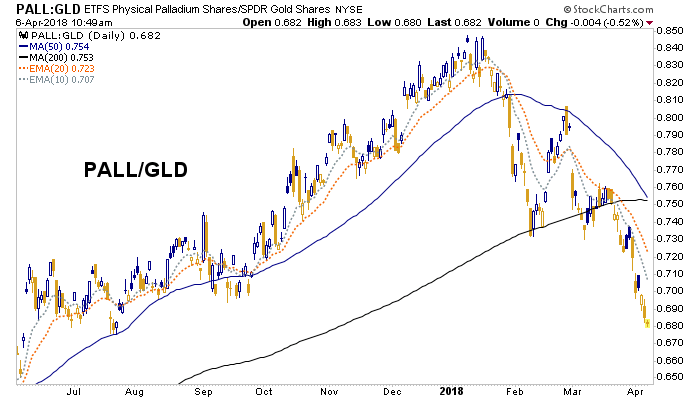
Aside from the Amigos, we have been watching the internals of the Semiconductor sector, which gave us the initial positive economic cycle clues in January-March of 2013 and a companion bullish indicator we used back then; cyclical Palladium vs. counter-cyclical Gold.
Well look here, daily PALL/Gold is tanking and as we noted in an NFTRH update during yesterday’s big up day in stocks, this was in negative divergence to any stock market joy.
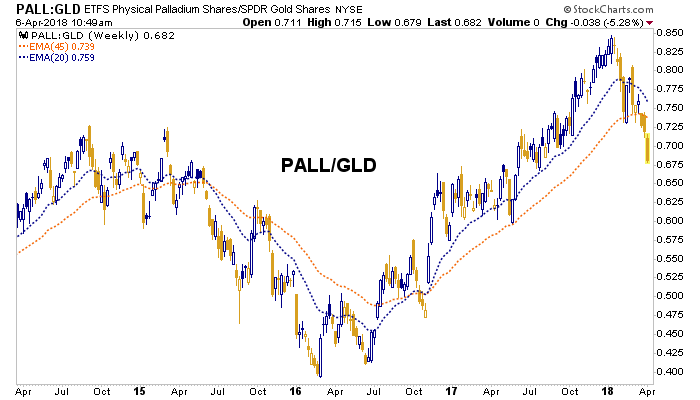
Weekly PALL/Gold is quite concerning as well. If the time comes that you see those two moving averages crossed down, it will be a solid bear signal for the economic cycle and most of the risk ‘on’ assets floating along with it.
The above is by no means comprehensive. There are many more indicators and considerations that we track each step of the way. But I don’t believe in just presenting my views for people to consider without backing them up with real data and historical touch points.
The above, from the Amigos to the Metallic Indicators like PALL/Gold are part of a macro picture that needs to be respected. For example, yields rose with the post-election bull, stocks out performed gold with the good times since 2011, the yield curve has flattened with the boom and Palladium rose vs. Gold on the positive cycle. If some or all of these trends continue to turn and/or start to turn you can rationally expect outcomes very opposite to the previous trends.
Personally, I am and have been in ‘balance’ mode with a very high cash level (T-bill funds paying increasing income with each Fed rate hike) until enough indicators say ‘start to lean dude!’.
Subscribe to NFTRH Premium for your 40-55 page weekly report, interim updates and NFTRH+ chart and trade ideas or the free eLetter for an introduction to our work. Or simply keep up to date with plenty of public content at NFTRH.com and Biiwii.com. Also, you can follow via Twitter ;@BiiwiiNFTRH, StockTwits, RSS or sign up to receive posts directly by email (right sidebar).
By Gary Tanashian
© 2018 Copyright Gary Tanashian - All Rights Reserved
Disclaimer: The above is a matter of opinion provided for general information purposes only and is not intended as investment advice. Information and analysis above are derived from sources and utilising methods believed to be reliable, but we cannot accept responsibility for any losses you may incur as a result of this analysis. Individuals should consult with their personal financial advisors.
Gary Tanashian Archive |
© 2005-2022 http://www.MarketOracle.co.uk - The Market Oracle is a FREE Daily Financial Markets Analysis & Forecasting online publication.