


Stock Market Close Below the 200SMA is Medium-long Term Bullish for Stocks
Stock-Markets / Stock Markets 2018 Apr 04, 2018 - 01:14 PM GMTBy: Troy_Bombardia

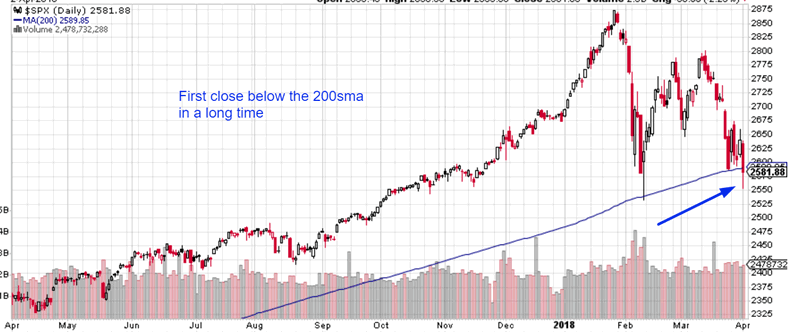
 The S&P 500 closed below its 200 daily moving average for the first time in 442 trading days yesterday. This is actually a medium-long term bullish sign for the U.S. stock market.
This means that the S&P 500’s trend was insanely strong from the second half of 2016 to January 2018. When the market’s trend was insanely strong and subsequently makes a “small correction”, that “small correction” doesn’t turn into a bear market.
Here’s what happens next when the S&P is above its 200 daily moving average for more than 400 trading days.
- January 29, 2018 (current case)
- June 23, 2014
- February 27, 1998
- June 27, 1955
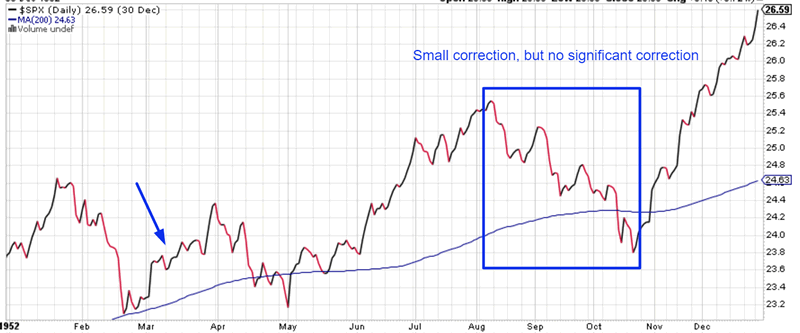
- March 7, 1952
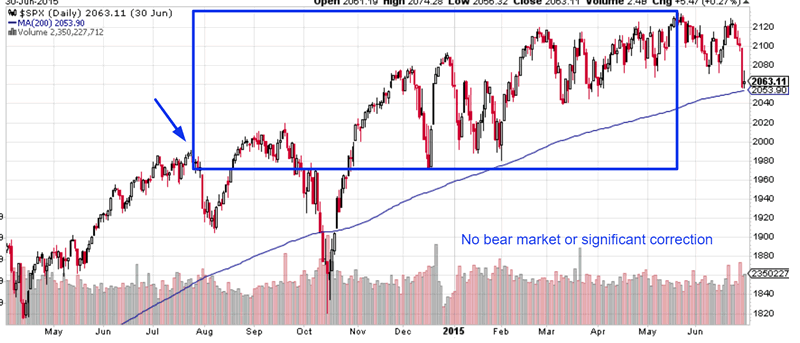
June 23, 2014
The stock market’s next correction was a 9.8% “small correction”. The next “significant correction” began 11 months later in May 2015. There was no bear market.
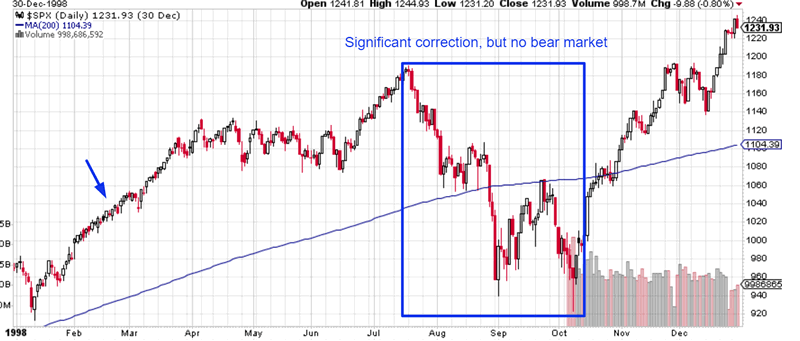
February 27, 1998
The stock market’s next 22.4% “significant correction” began 5 months later in July 1998. To use this analogue, 5 months after January 29, 2018 is June 29, 2018. The 1998 “significant correction” did not turn into a bear market. The bull market topped in March 2000.
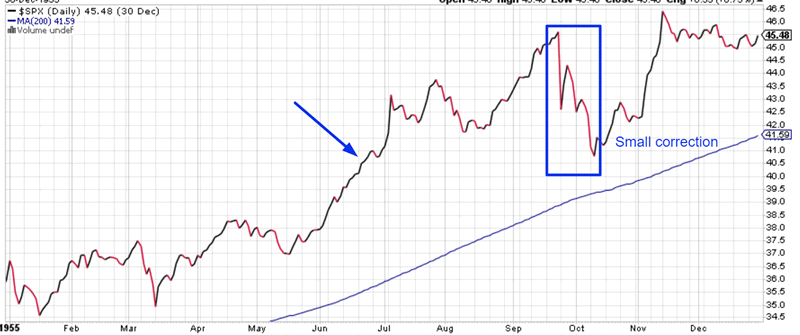
June 27, 1955
The S&P’s next correction was a 10.5% “small correction” that began 3 months later in September. The next 21.4% “significant correction” began more than 1 year later in August 1956. There was no bear market.
March 7, 1952
The next correction was a 6.8% “small correction” that began 5 months later in August. The next 14.8% “small correction” began 9 months later in January 1953. There was no bear market.
Conclusion
This study suggests that the stock market’s current decline isn’t the start of a bear market.
The stock market doesn’t just die into a bear market when its previous trend was insanely strong (e.g. in 2017). The last big rally in a bull market see bearish divergences and increases in volatility, neither of which were present in the 2017 rally.
We are in the process of making these bearish divergences. The S&P 500 will make a new all-time high before this bull market ends, but momentum and breadth won’t.
The stock market’s recent volatility is normal for the last 1-2 years of a bull market. The first breakdown below the 200 daily moving average in a long time isn’t the start of a bear market.
By Troy Bombardia
I’m Troy Bombardia, the author behind BullMarkets.co. I used to run a hedge fund, but closed it due to a major health scare. I am now enjoying life and simply investing/trading my own account. I focus on long term performance and ignore short term performance.
Copyright 2018 © Troy Bombardia - All Rights Reserved
Disclaimer: The above is a matter of opinion provided for general information purposes only and is not intended as investment advice. Information and analysis above are derived from sources and utilising methods believed to be reliable, but we cannot accept responsibility for any losses you may incur as a result of this analysis. Individuals should consult with their personal financial advisors.
© 2005-2022 http://www.MarketOracle.co.uk - The Market Oracle is a FREE Daily Financial Markets Analysis & Forecasting online publication.