


Improving Moving Average Systems with Andrews Pitchfork
Stock-Markets / Technical Analysis Apr 04, 2018 - 03:30 AM GMTBy: Submissions

 By Ron Jaenisch:
In Traders world publication last year, “A Winning System” was included, by this author. The system was a 50/100 week moving average crossover system. A track record was shown that documented the systems 100% record of winning trades for the last eighty years.
By Ron Jaenisch:
In Traders world publication last year, “A Winning System” was included, by this author. The system was a 50/100 week moving average crossover system. A track record was shown that documented the systems 100% record of winning trades for the last eighty years.
Since I learned Andrews and Babson techniques, from Dr. Alan Hall Andrews at his kitchen table and use them in my own trading, I decided to experiment with the idea of combining the Pitchfork with the crossover moving average system. This article will show some of the results of this experiment.
The moving average crossover system enters the long position in the S&P when the fifty week moving average crosses above the one hundred week moving average and exits when the fifty week crosses below the one hundred week moving average.
Andrews taught that price makes it to the median line eighty percent of the time and to buy after a decline and sell after a rally. To make the median line work in conjunction with this system buy signals are only achieved if the MA system is already long and price comes down to a Median Line.
After a very long run, price going past the median line for the first time or the median line far parallel may be used for a sell signal.
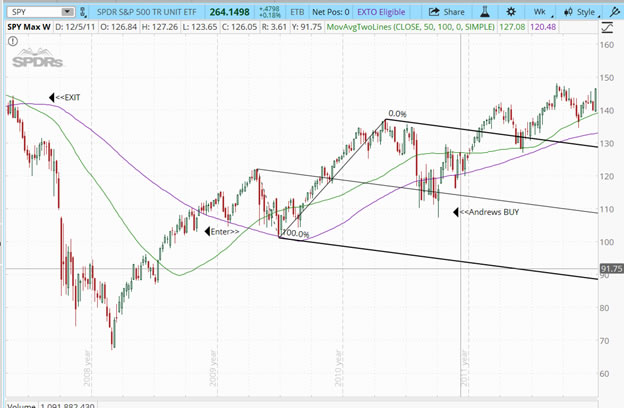
In the above chart an entry signal was achieved with the moving average and after a decline the Andrews Buy signal kicked in. This was when the moving average system was still long.
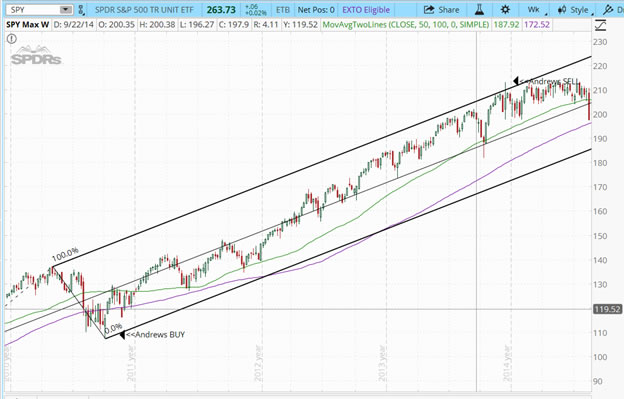
Over time the S&P went up and the moving average system stayed long. After price went to the Pitchfork far parallel an Andrews sell signal was achieved.
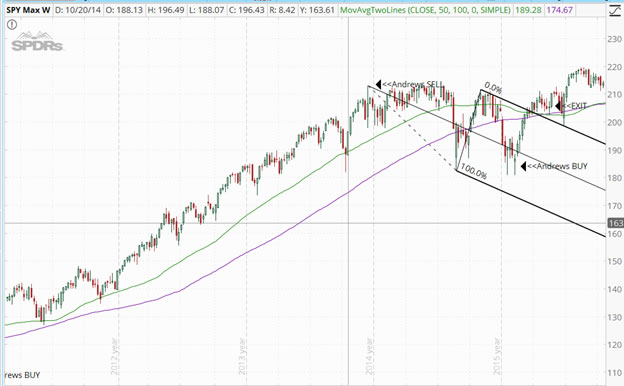
As seen in the above chart, the market went sideways and down for about a year. The crossover system was still long and an Andrews Buy signal was achieved after the market went down to the median line.
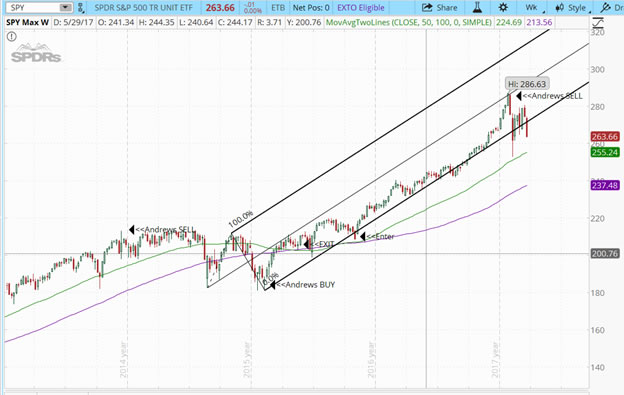
The MA system had an exit signal a few months later and once again took profits. Shortly before the election another enter long signal was achieved. At this time both the Andrews tech and the MA system were both calling for higher prices. After the election price went further to the upside, until finally price made it to the median line where a sell signal was achieved, thereby locking in the Trump tax code rally profits.
The Author publishes a weekly quick one minute video trade of next week forecast each week at
http://www.andrewscourse.com/news/default.htm
© 2018 Stefan Gleason - All Rights Reserved
Disclaimer: The above is a matter of opinion provided for general information purposes only and is not intended as investment advice. Information and analysis above are derived from sources and utilising methods believed to be reliable, but we cannot accept responsibility for any losses you may incur as a result of this analysis. Individuals should consult with their personal financial advisors.
© 2005-2022 http://www.MarketOracle.co.uk - The Market Oracle is a FREE Daily Financial Markets Analysis & Forecasting online publication.