


SPX Wedge Breaks and Double Gaps: Capatulation but GOLD is Coiling for Breakout
Stock-Markets / Financial Markets 2018 Mar 24, 2018 - 05:10 PM GMTBy: Submissions

 Arb Cap writes: The stock market continued its correction lower with a sharp downmove the last nine days (12 to 22 March). The S&P 500, Dow Industrials and Nasdaq 100 lost more than five percent, while the S&P Mid-Cap 400 and S&P Small-Cap 600 fell 3.76% and 2.77%, respectively. The Dow Industrials (red) was the first back to negative territory with a move below the zero line on Monday, while the S&P 500 (black) and S&P Mid-Cap 400 (blue) followed suit on Thursday. The S&P Small-Cap 600 and Nasdaq 100 remain positive year-to-date.
GOLD:SPX ratio at inflection
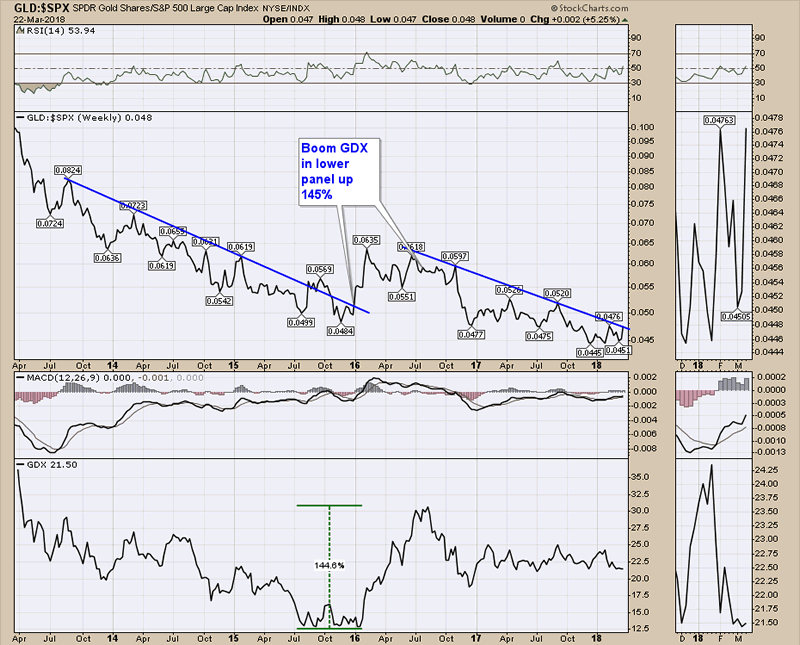
One of the key charts that determine relative performance of commodities to stocks is the gold spx ratio. This chart is banging against a long term trend line. A break above will suggest that Commodities will start outperforming the broader equity markets. The consumer sector highlow has already broken below the 20 EMA which is suggesting weaker economy. But for stock markets it is all about rotation. We will see more money flow into hard assets from here once the ratio breaks out. The ratio will break out once Gold starts to break out on the long term charts.
GOLD charts long term
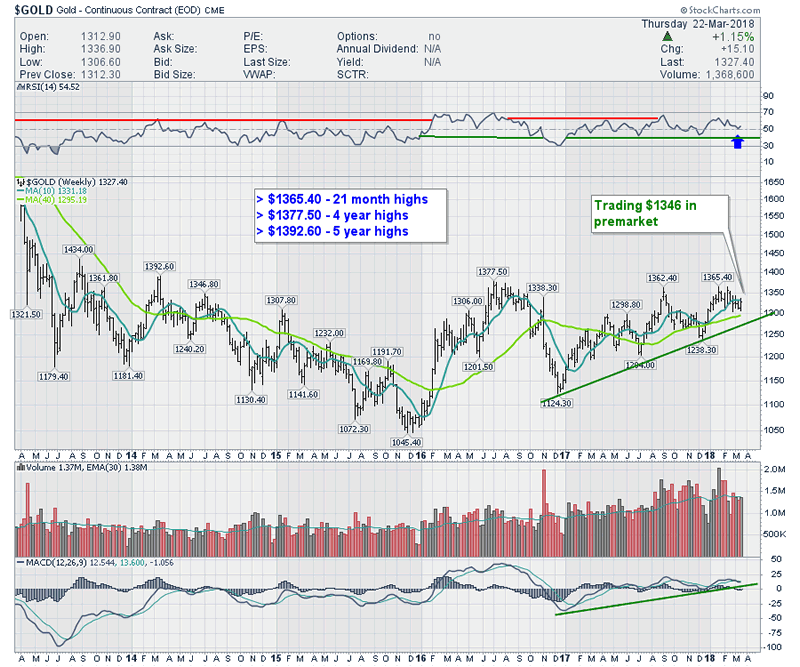
The volume has another day to go so this week should have a volume candle well above 1.5 M. With all the volume on the right edge of the chart, this looks like added pressure to the upside. The MACD is coiling nicely above zero. This is a very bullish setup from here.
GOLD charts short term
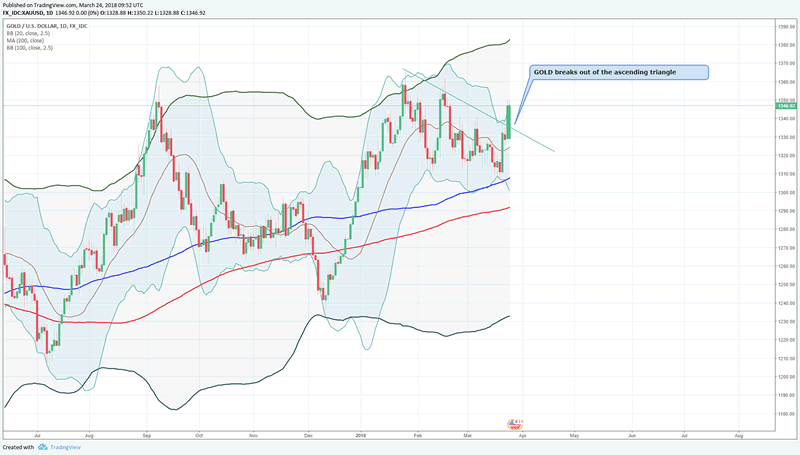
Gold has broken out in the medium term. It has overcome key resistance 1330 levels and RSI is well directed.
Market update: Last week - Capatulation
Double Gap in Technology ETF
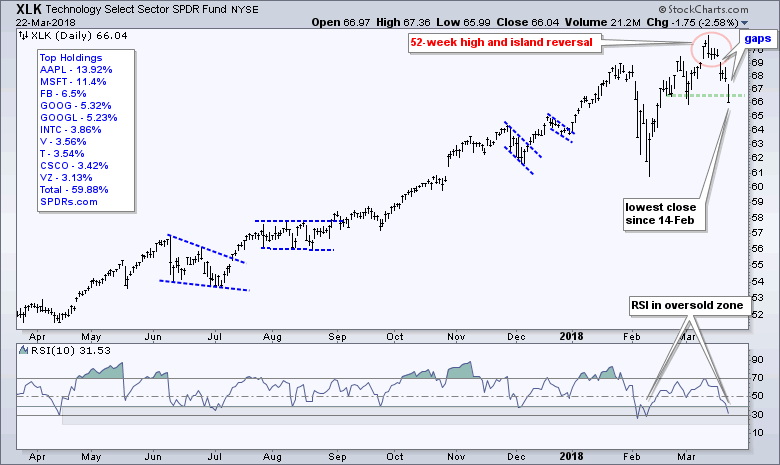
XLK made new highs just 2 weeks back and since then has fallen 6%. XLK fell over 10% in nine days in February and this is the second sharp decline in as many months. There two breakaway gaps as price broke below the triangle. Note that several tech-related ETFs also formed breakaway gaps on Monday (FDN, SKYY, HACK, IGV). The tide is turning against the Tech financial industry. The glorious years enjoyed by tech companies flaunting their small piddly little innovations are now coming to an end. Imagine a world where companies like Uber are hailed as innovators (Connecting a few thousand cabs to cnetral server is innovation for them). However, it is not enough to turn long-term bearish on XLK as it remains well above the February low. But the two gaps are showing that money is starting to pull away.
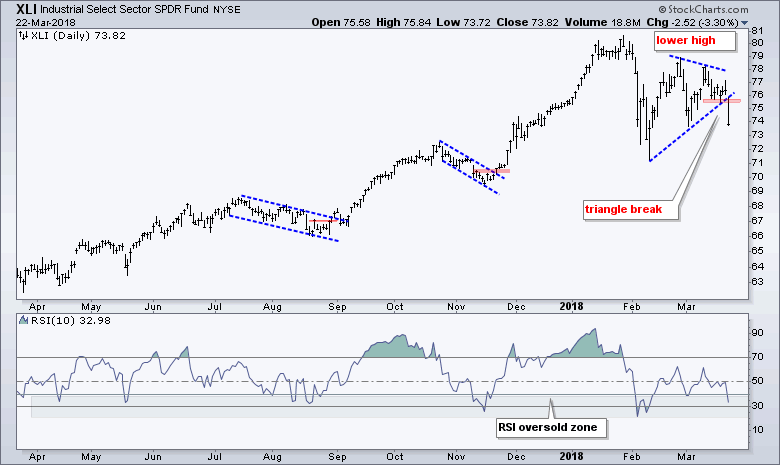
The Industrials SPDR (XLI) broke the triangle consolidation zone from Feb to March. It broke down with a gap and sharp decline on Thursday. This signals a continuation of the prior decline. We are turning bearish on Industrial pack.
The next four charts show lower highs and wedge breaks in the Financials SPDR (XLF), Health Care SPDR (XLV), Consumer Discretionary SPDR (XLY) and Materials SPDR (XLB). These four also formed lower highs. As noted above, the rising wedge is typical for a corrective bounce after a decline. These wedge breaks signal a continuation of the prior declines and project a move below the prior low. The projection is not what is important because targets are just guesstimates. The wedge breaks are important and in force until proven otherwise.
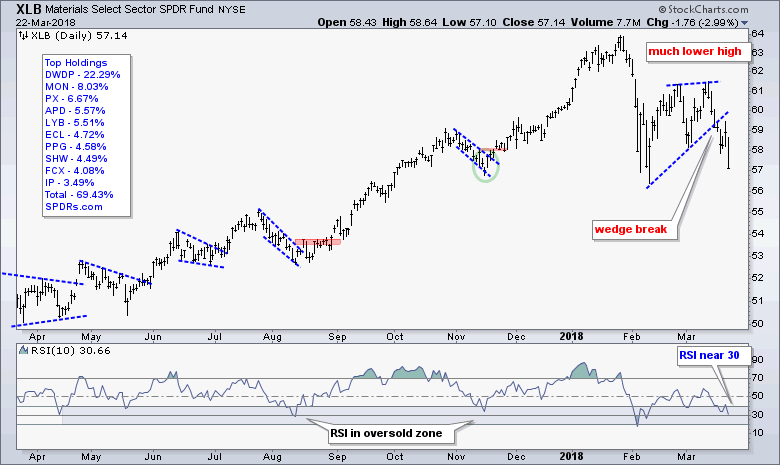
Materials SPDR (XLB) show a bounce and rising wedge. This typical after a damage from a previous breakdown. The wedge is now broken to the downside and it firmly is pointing to a min of 10% decline from these levels.
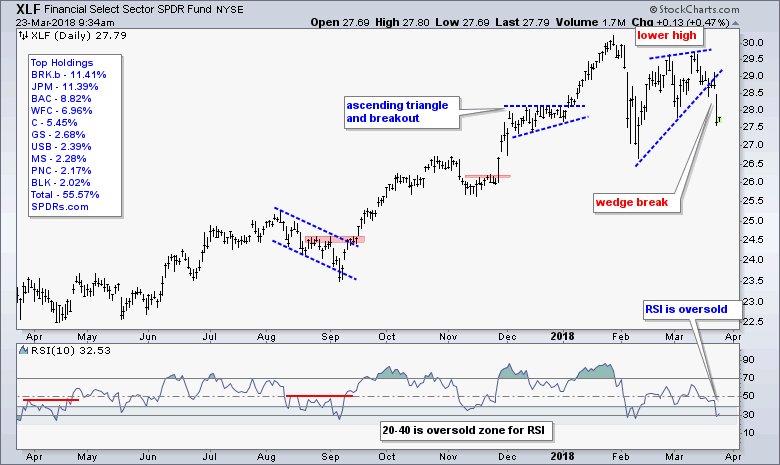
The Financial ETF, XLF, was in a rising wedge which had just about come to the previous highs but in the end made a lower high. The wedge was much stronger but has broken to the downside. Next week will be important to see if prices will push back inside the wedge.
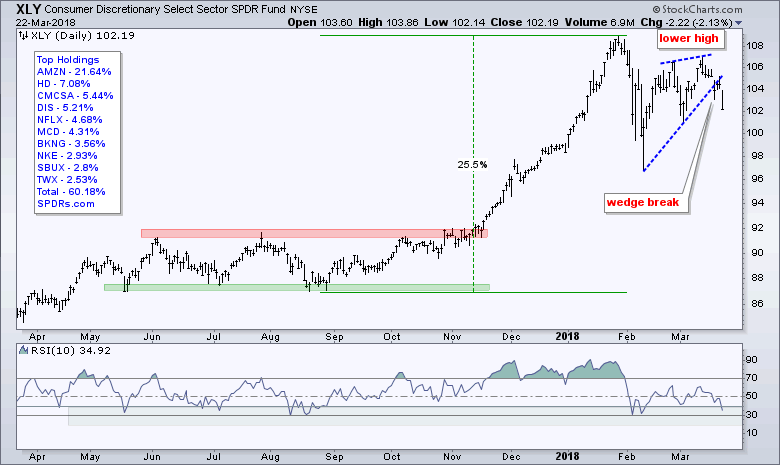
Consumer Discretionary SPDR (XLY) was also in a corrective bounce but Friday move has now broken the wedge down.
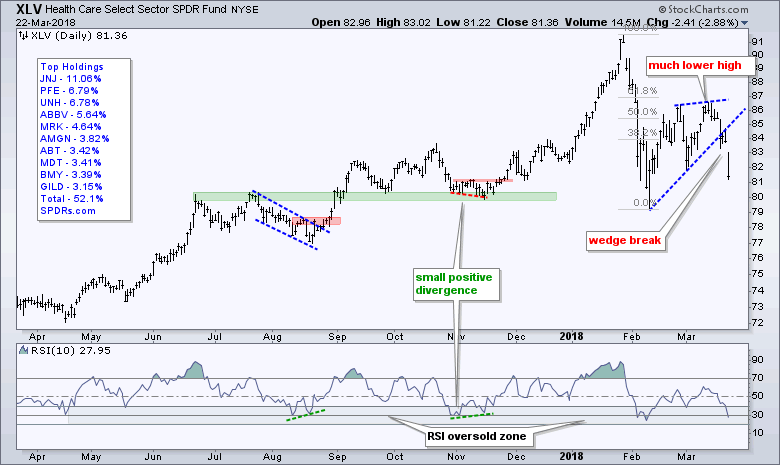
Health Care SPDR (XLV) has broken the rising wedge down. The wedge was much weaker than the one see for material ETF. The break has been sharp with a gap. The RSI is oversold but is pointing down.
Broader Market: Damage is deep, Bearish Trend
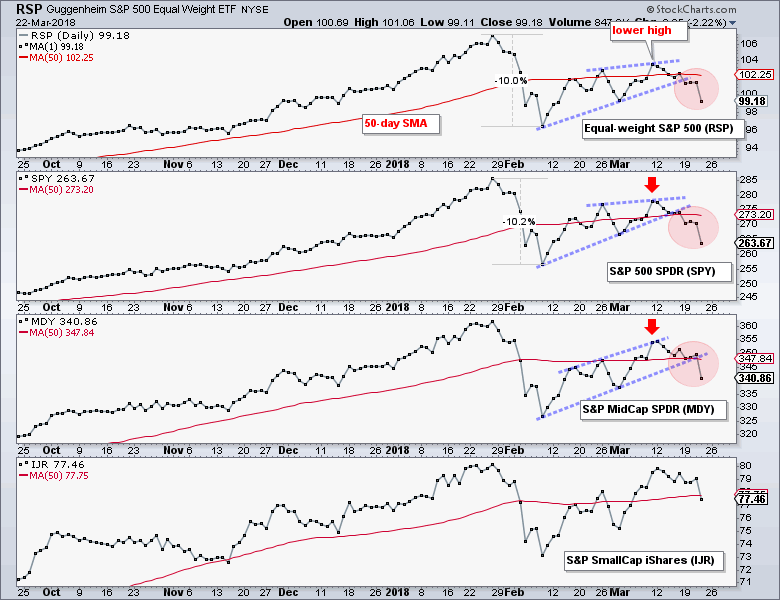
Te Equal-Weight S&P 500 ETF (RSP), the S&P 500 SPDR (SPY), the S&P MidCap SPDR (MDY) and the S&P SmallCap iShares (IJR) represent the lion's share of the stock market: SPY for large-caps, RSP for the average stock in the S&P 500, MDY for mid-caps and IJR for small-caps. Notice that the EW S&P 500 ETF and SPY fell 10%, bounced with rising wedges, peaked below the January high and b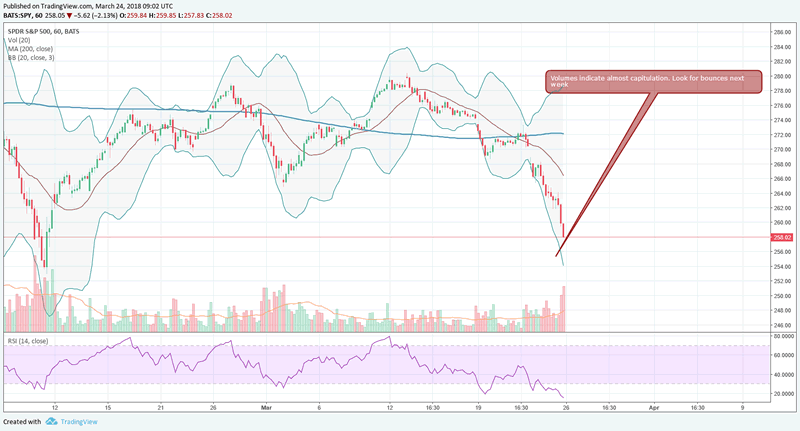
roke the wedge lines. These two also closed below the early March low and this means lower lows also formed. The big trend could be
turning down here. The third window shows MDY making it closer to the January high, but still falling short and breaking down on Thursday. The lower window shows IJR almost reaching its January high and then turning down. Perhaps IJR is forming a double top, but this is a moot point because SPY and RSP already broke down. IJR is not going to buck the big boys.
Drilling deeper:
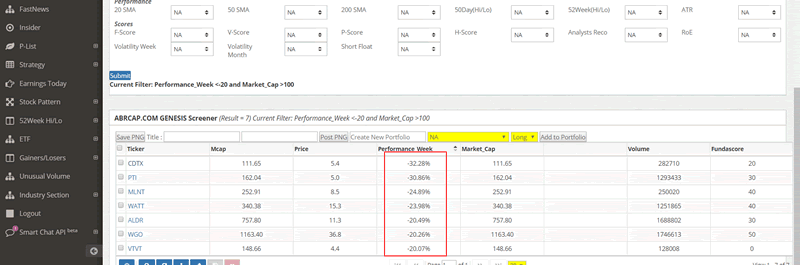
These stocks that fell over 20% last week.
Stay ahead of the market: Get abrcap pro membership
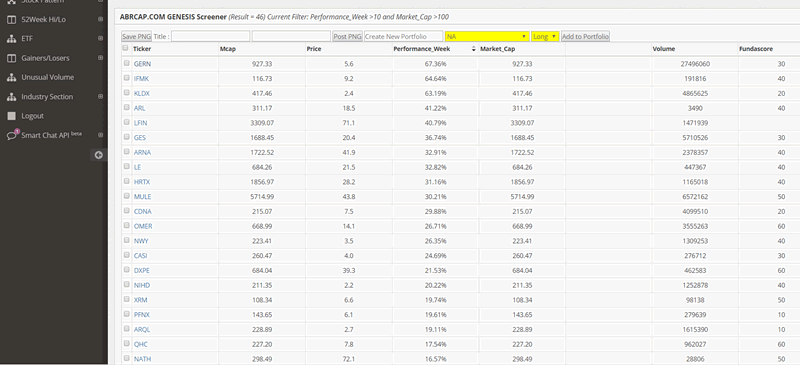
The highest performing stocks for the week are shown above. 46 stocks still found strength to rise over 10% this week. GERON rose nearly +67%. While the index has corrected, there is still bullish strength in stocks.
The following indicator is probably the only flash point among all indicators that there may be some possibility of a major bounce in the stocks markets to test the previous highs. The abrcap.com trend indicator is only a shade below previous highs. This indicator is constructed from market internals, shows that there is a possibility of index to make a double bottom near 2530 or before and rise back to previous highs. In a world where every indicator is based on price action and often follows price, we may need to be serious of a indicator when it goes contrarian against everything else out there.
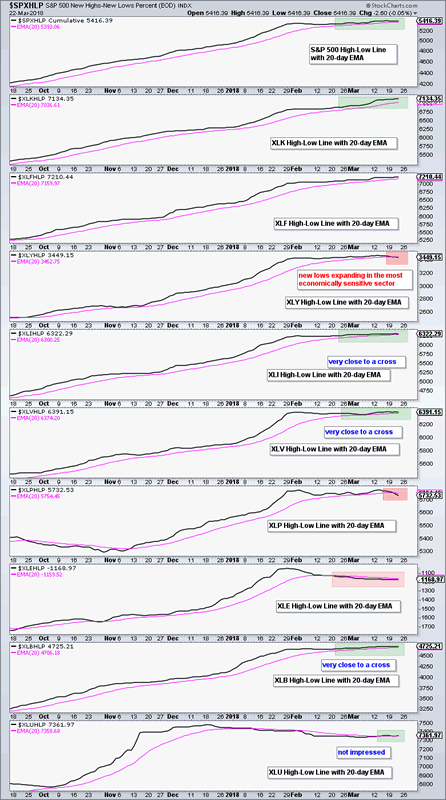
Four of the five lines are still above their 20-day EMA, but the Consumer Discretionary High-Low Line moved below its 20-day EMA. This is the most economically sensitive sector and weakness here does not bode well. The bulk of the evidence turns bearish when/if two more High-Low Lines join the consumer discretionary sector with downturns. Industrials and healthcare are pretty close. But the fact that the broader market has corrected over 10% in the last 2 weeks and yet the newhigh-low line is just about 20 EMA shows there is signficant money that is flowing into select stocks. The environment is not as bearish as the broader index correction. Also the index has now reached some major support areas at 2588 and then below at 2530.
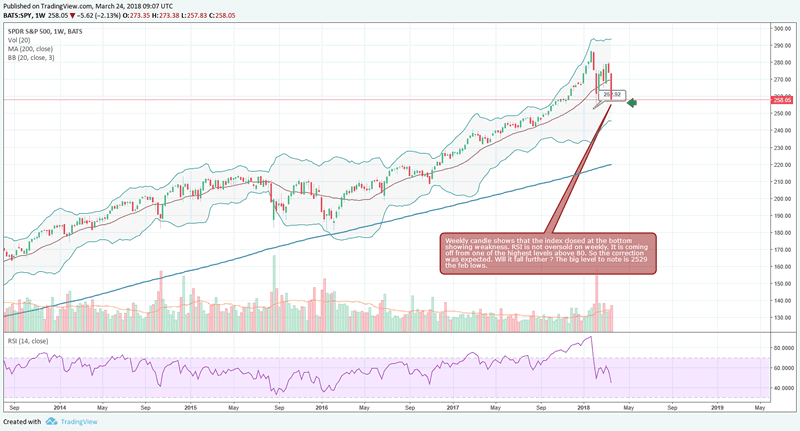
Summary: We think the major part of the correction is now getting to a close. We saw a pickup in volumes as friday drew to an end. That is a sign of capitulations. There will be some more follow up next week but we need to watch the velocity of any further correction. The big level to watch on the downside will be the whole area between 2500 and 2530. If 2520 gives way with volume, we could see another 10% correction at a faster pace than the 10% correction we have seen in the last 9 days.
By Arb Cap
About abrcap Pro Membership:
ABRCAP.COM provides detailed daily chart setups and stock picks both from a long term and short term perspectives. Our daily analysis and updates on the markets is well appreciated. It prepares traders for trading opportunities. To become PRO client, please subscribe here: abrcap.com PRO membership
Copyright 2018 © Arb Cap- All Rights Reserved
Disclaimer: The above is a matter of opinion provided for general information purposes only and is not intended as investment advice. Information and analysis above are derived from sources and utilising methods believed to be reliable, but we cannot accept responsibility for any losses you may incur as a result of this analysis. Individuals should consult with their personal financial advisors.
© 2005-2022 http://www.MarketOracle.co.uk - The Market Oracle is a FREE Daily Financial Markets Analysis & Forecasting online publication.