


Return of Stock Market Volatility Amidst Political Chaos and Uncertain Economy
Stock-Markets / Stock Markets 2018 Mar 18, 2018 - 05:07 PM GMTBy: Submissions

 Buildadv writes: For stock market investors, the coming week is likely to see the Federal Reserve move back into focus, stealing the spotlight back, at least briefly, from worries about tariffs and political turmoil. The Fed’s two-day policy meeting, which will conclude Wednesday and is widely expected to deliver the first rate increase of 2018, will be Fed Chairman Jerome Powell’s first as chairman of the central bank, and investors will be eager to find out just how much he deviates from the legacy of Janet Yellen, whom he succeeded in early February.
While market participants have fully priced in a quarter-percentage point rate increase on Wednesday, investors will parse the wording of the accompanying statement and Powell’s subsequent news conference. According to Atlanta Fed’s GDPNow tracker, the U.S. economy is estimated to have expanded at a 1.8% clip during the first quarter of this year, which is twice the average rate for this period throughout the recovery. But higher rates are still likely to dent some industries that are seen as bond proxies, such as utilities, telecoms or consumer staples. These sectors have already been underperforming and may continue to do so for some time, according to Jaffee. Since the start of the year, telecoms, utilities and consumer staples are down between 4.5%-6.5%.
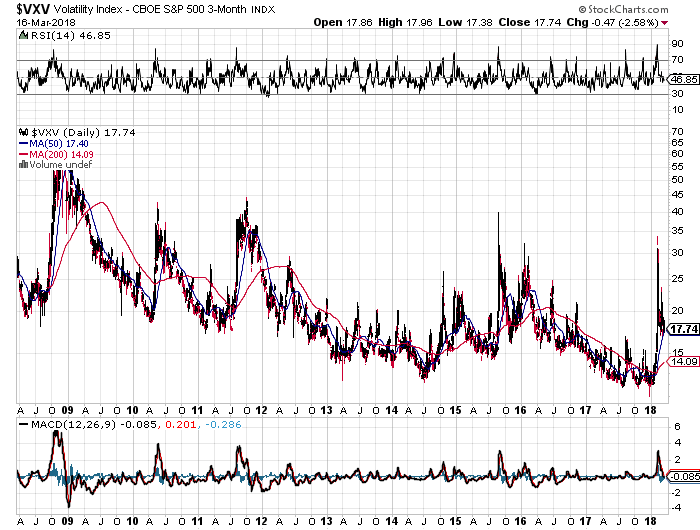
The VXV volatility 3 month index pushed higher but since then has dropped to 17. However it has not yet fallen under 14 which is the key level to notice market comfort. Till it stays 15 and above, market risk a deep correction.
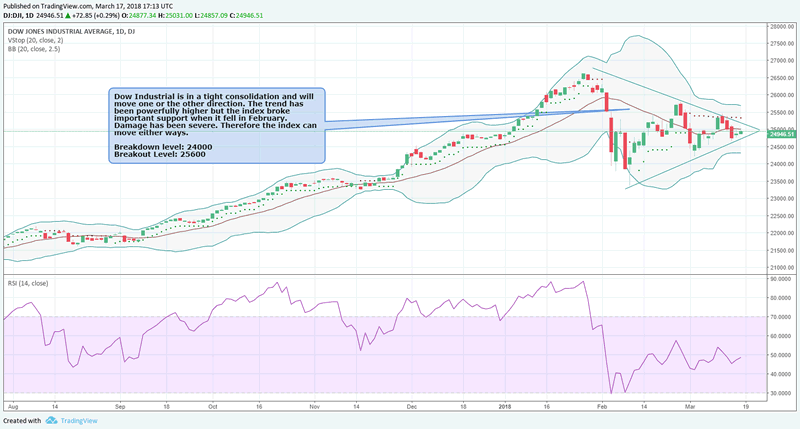
Dow Industrial is in a tight consolidation and will move one or the other direction. The trend has been powerfully higher but the index broke important support when it fell in February. Damage has been severe. Therefore the index can move either ways.
Breakdown level: 24000
Breakout Level: 25600
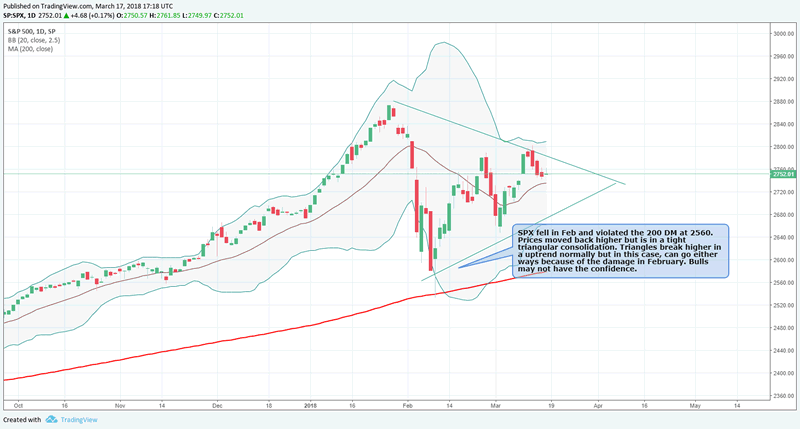
SPX fell in Feb and violated the 200 DM at 2560. Prices moved back higher but is in a tight triangular consolidation. Triangles break higher in a uptrend normally but in this case, can go either ways because of the damage in February. Bulls may not have the confidence.
Sensing the chart patterns, fund managers poured billions in the past week into stock purchases. Global investors ploughed a record $43bn into stock funds and ETFs in the past week, with an inflow that exceeded the previous record set after the 2016 election of Donald Trump. The $34.9bn net inflow into funds tracking US stocks was big enough to help America shed a year-to-date outflow, according to EPFR data compiled by investment bank Jefferies tracking March 8 - 14. Within the US, the technology and consumer discretionary sectors both had record inflows at $8.6bn and $4.9bn respectively, while financials drew $6.8bn. Ructions in February that sent the benchmark US S&P 500 index briefly falling into a technical correction sparked concerns that the nine-year-old bull market could be running out of steam. But sentiment has once again turned optimistic.
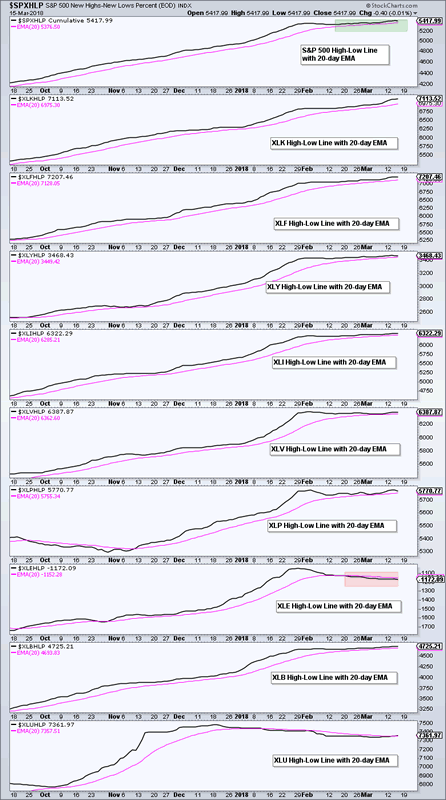
Currently, the S&P 500 High-Low Line is above its 20-day EMA and eight of the nine sector High-Low Lines are above their 20-day EMAs. Thus, new highs are still outpacing new lows for most sectors and this supports the uptrend in the broader market. The trouble starts if/when the S&P 500 High-Low Line and the majority of sector High-Low Lines turn down. Thus, watch these lines over the coming days and weeks.
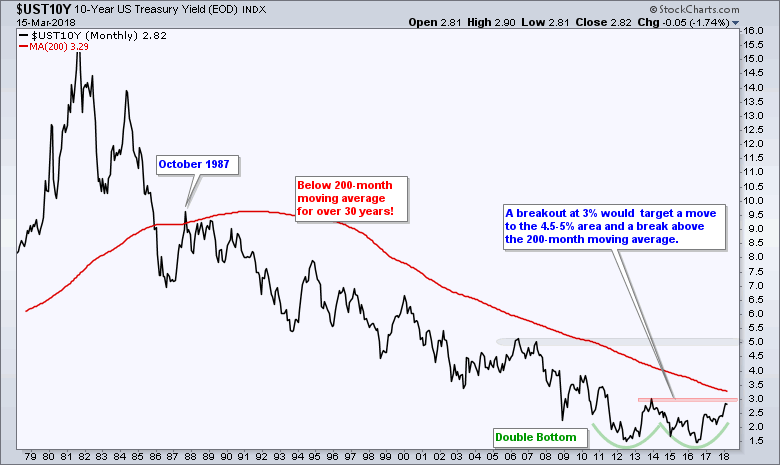
The US 10Year yield is at 2.85% a shade under 3%. The yields has been on a multi year downtrend. The level that will break away from the secular downtrend is 3%. If yields rise above 3%, we will have major market upheavals. Currently, fund managers and big money seems to composed that yields drop below to 2.3% again. Equity markets will correct in a big way initially if 3% gives way.
Bitcoin
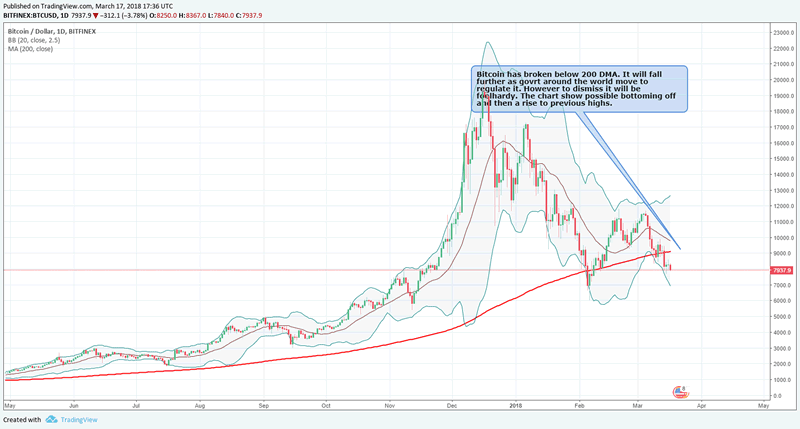
Bitcoin has broken below 200 DMA. It will fall further as govt around the world move to regulate it. However to dismiss it will be foolhardy. The chart show possible bottoming off and then a rise to previous highs.
Economy
Generally speaking the US economy has been doing well. Jobs data has been holding up while consumer sentiment is on the rise. Inflation expectation is rising while house prices are stable with no major slowdown being witnessed.
Consumer Sentiment
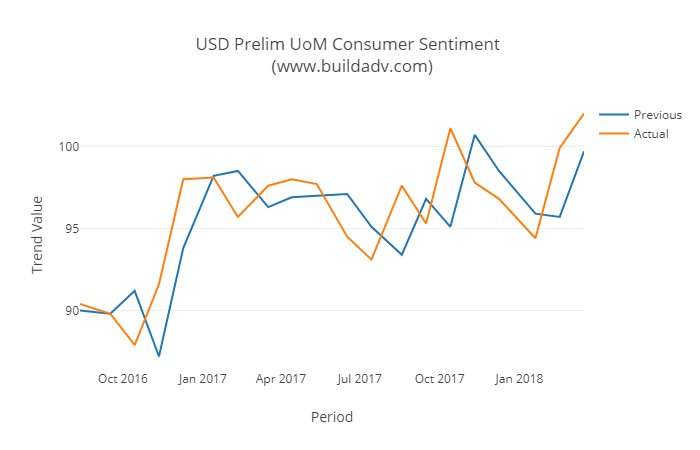
The US Consumer sentiment rose above 102 in a powerful surge in February.
Consumer Inflation Expectation
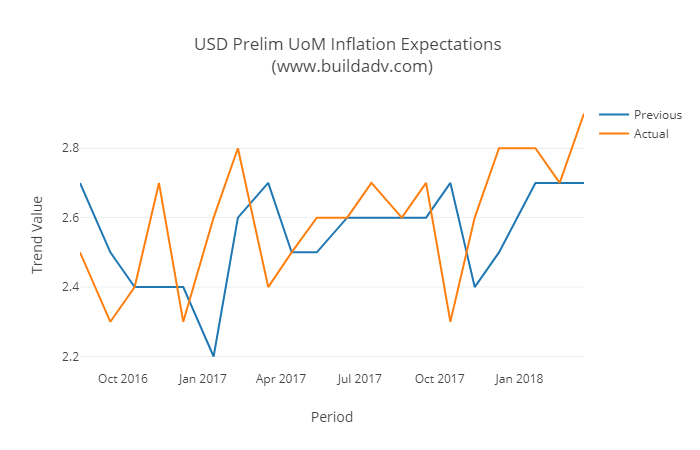
Hidden inside the consumer sentiment data was the expectation that prices are going to rise. Inflation is on its way.
Small Business Sentiment
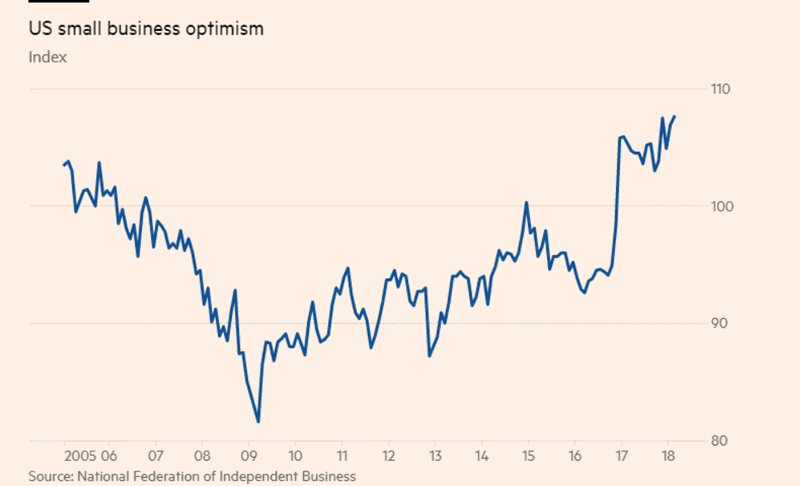
FT reports that after the November 2016 victory both financial markets and business sentiment embarked on an upward trajectory that has seen few interruptions. The NFIB’s reading for overall optimism among small company bosses is now at its highest since 1983 and the second-strongest in its 45-year history. A separate gauge of confidence among big business from the Business Roundtable is its best since its inception 15 years ago.
Valuation
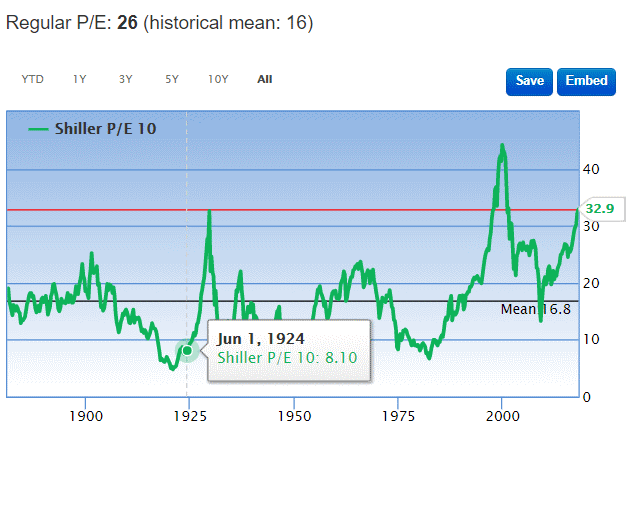
The market valuation is touching 2000 levels of 33 p/e X. Only twice in history have we seen 32x. Both times things did not end well. We believe this chart is an extremely important chart and shows how close we are to final breakout in market indices and then a full blown market correction lasting years together. Not with standing all the euphoria of a great economy, the world debt has grown to record levels.
Global debt rose to a record $233 trillion in the third quarter of 2017, more than $16 trillion higher from end-2016, according to an analysis by the Institute of International Finance. Private non-financial sector debt hit all-time highs in Canada, France, Hong Kong, South Korea, Switzerland and Turkey. At the same time, though, the ratio of debt-to-gross domestic product fell for the fourth consecutive quarter as economic growth accelerated. The ratio is now around 318 percent, 3 percentage points below a high set in the third quarter of 2016, according to the IIF.
USDJPY warning
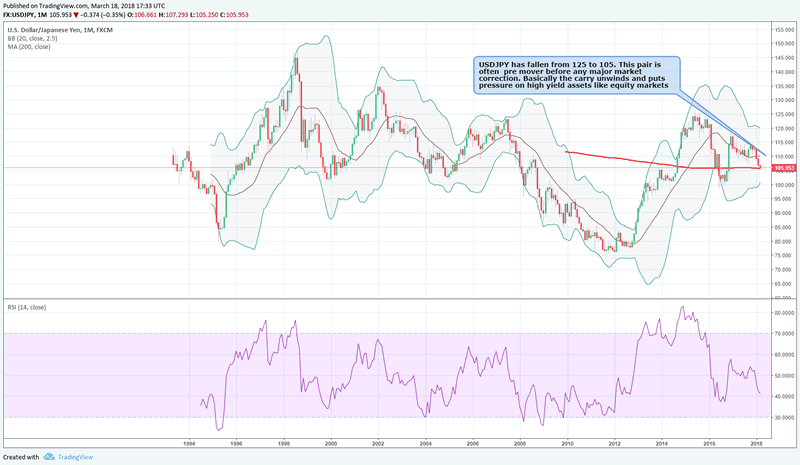
USDJPY has fallen from 125 to 105. This pair is often pre mover before any major market correction. Basically the carry unwinds and puts pressure on high yield assets like equity markets. We see more downside in USDJPY. Central banks around the world are removing stimulus and this is leading to an unwind of carry trade. The consequence of this will be felt in the coming months.
Political Chaos
Can political chaos coexist with economic success? We know that political paralysis does not seem to matter much, at least in the short run. Look at Germany. It has just had six months with only a caretaker government and the economy cantered on just fine. But chaos? In the US chaos has doubled, redoubled and in spades. In the past few days Donald Trump has sacked his Secretary of State, Rex Tillerson. He has enthused about the firing of the former deputy director of the FBI, Andrew McCabe (Trump tweeted: “a great day for democracy”). And most recently he has instructed his lawyers to sue Stephanie Clifford, professionally known as Stormy Daniels, for $20 million for allegedly breaching a non-disclosure agreement after they had had an affair.
We are witnessing one of a kind circus in washington but one that has not interfered with the stock market as of yet. But things could change esp as we see the market are fully priced at 32x. Volatility has come back to market and it may just be warning us that things are a bit more worrisome under the hood.
Other Key highlights from trading in March
- The Home Construction iShares (ITB) continues to lag because it formed a lower low in early March and did not exceed its late February high.
- The Retail SPDR (XRT) is also lagging because it fell short of the February high. A consolidation formed the last five weeks and a line break would signal a continuation of the February decline.
- The Cloud Computing ETF (SKYY), Cyber Security ETF (HACK), Internet ETF (FDN), the Networking iShares (IGN), the Semiconductor iShares (SOXX), the Semiconductor SPDR (XSD) and the Software iShares (IGV) surged 15+ percent the last five weeks and hit new highs. They are looking extended for the short-term, but not weak and still the leaders.
- The Broker-Dealer iShares (IAI) hit a new high on Monday and remains one of the leading industry-group ETFs.
- The Regional Bank SPDR (KRE) hit a new high on Monday and the overall trend is up.
- The iShares Aerospace & Defense ETF (ITA) stalled the last few weeks, but the long-term trend is still up and the cup-with-handle remains a possibility.
- The Oil & Gas Equip & Services SPDR (XES) is one of the weakest industry group ETFs right now. A consolidation formed after the sharp decline and this is a bearish continuation pattern. A strong breakout at 16 would call for a re-assessment.
- The Agribusiness ETF (MOO) got hit hard the last four days. A lower high could be forming along with the rising wedge. A close below the early March closing low (61.7) would be bearish. The Gold Miners ETF (GDX) may be testing a large support zone, but it is still one of the weakest industry-group ETFs over the last three, six and twelve months.
Summary: Not withstanding the chart pattern and super lative jobs data, we believe its time to be cautious. Damage has been done on equity indices in Feb. That is the first warning. It happened despite a great economy. We believe the bounce and some more breakout like moves will masquerade before market correct severely in 2018.
By Buildadv
About Buildadv:
Buildadv is a investment management firm. We specialize in premium trading research, chart setups, trading insights and a forex trade copier which generates returns for MT4 trading clients. We operate the BUILDFX Trading system which has a rich history of over 8 years of trading history generating an average return of over 15% a month.
Email: adminsupport@buildadv.com
Website: http://buildadv.com/contact/
Copyright 2018 © Buildadv - All Rights Reserved
Disclaimer: The above is a matter of opinion provided for general information purposes only and is not intended as investment advice. Information and analysis above are derived from sources and utilising methods believed to be reliable, but we cannot accept responsibility for any losses you may incur as a result of this analysis. Individuals should consult with their personal financial advisors.
© 2005-2022 http://www.MarketOracle.co.uk - The Market Oracle is a FREE Daily Financial Markets Analysis & Forecasting online publication.