


Intraday Spot Gold Trading with GLD ETF
Commodities / Gold & Silver Sep 08, 2008 - 05:30 PM GMTBy: Chris_Vermeulen
 Today was another one of those great days for a spot gold trade using the free intraday charts by Kitco. I'm not sure if anyone watched the free Kitco 24 Hour Spot Gold Chart which is shown below but I watch it like a hawk. It doesn't take long to get a feel for how gold moves through out the 24hr day. Once you get a feel for it and see the same things happen every week opportunities start to pop up on the radar.
The Kitco Spot Gold Chart which is provided for free is an amazing tool for observing the spot gold price over a 3 day time frame. What I'm going to show you is how it can provide opportunities for daytrading the spot gold price or the gold GLD ETF.
Free Spot Gold Charts – By Kitco
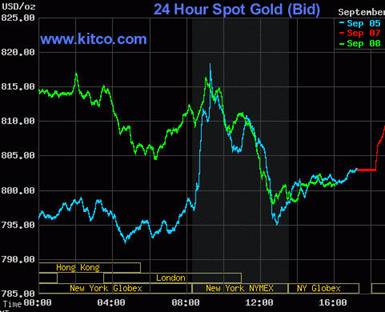
This chart may not look like a quality trading tool but it provides very detailed information for daytrading gold and for swing traders as they get ready to enter or exit a position at the open or close of the trading session. As you look at the chart above you will notice that the price movement each day is very similar even though the price of spot gold is different. Often enough the movements are very similar allowing us to take advantage daytrading the spot gold prices.
Close Up of the Spot Gold Chart
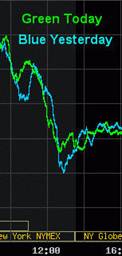 This picture does not look like much but it is North America 's standard market trading times 9:30am – 4:00pm ET. You can see the price action following the previous day's movements. Blue is the previous trading day and Green is Current Trading day. When I see big price movements in gold during these hours I like to take advantage of it the following day. If you didn't notice the Green line (Today) makes the move before the previous days move. Why? Looks to me like there are a lot of other traders out there like me getting ready for these opportunities making the spot gold price move before the previous day's action. Today the market was 20-30 ahead of the previous moves which happens and should be factored into your trading if you notice this.
Intraday Spot Gold Chart
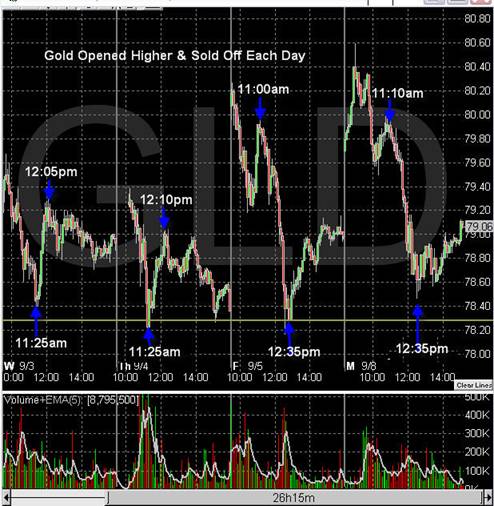
This shows the last 4 spot gold prices using GLD ETF. As you can see the last for days had the same price movement although today had a larger range to take more profits. This is a 5 minute spot gold chart using GLD. I trading using the 1 minute chart as it allows the best timing to entering and exiting the positions and keep the 5 minutes chart which you see above running as well to keep my head clear for the time and potential price movement.
Today's Spot Gold Trading Chart
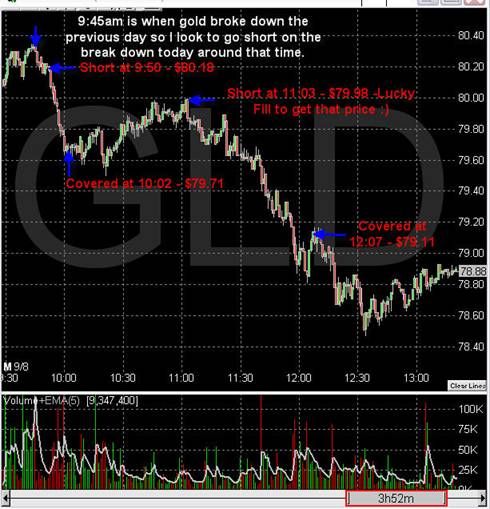
Above is the chart I use for trading GLD and my actual trades. I am a very conservative traders and I like to lock in profits. Sometimes I get out a little too early but I generally catch the middle trending moves which are the safest times to trade in my opinion. I could have held the trade longer today but spooked myself out of the trade because of over thinking. This is the exact reason why I use the 5 minute chart to keep me head on straight but sometimes it's till not enough and I take profits early.
When there are no swing trading setups I focus on finding these intraday daytrading gold patterns.
My main focus for trading is swing trading gold ETFs. I wait for a trend reversal or continuation pattern which satisfies my trading model, enter the trade and then exit 50% of position on the first sign of weakness. And exit the second half of the position on a trend line break. My swing trading goal for GLD ETF is 2-5% per trade which would last 2-10 days unless price continues to run. I generally have 10-20 trades per year with GLD gold ETF.
By Chris Vermeulen
Chris@TheGoldAndOilGuy.com
Please visit my website for more information. http://www.TheGoldAndOilGuy.com
Chris Vermeulen is Founder of the popular trading site TheGoldAndOilGuy.com. There he shares his highly successful, low-risk trading method. For 6 years Chris has been a leader in teaching others to skillfully trade in gold, oil, and silver in both bull and bear markets. Subscribers to his service depend on Chris' uniquely consistent investment opportunities that carry exceptionally low risk and high return.
This article is intended solely for information purposes. The opinions are those of the author only. Please conduct further research and consult your financial advisor before making any investment/trading decision. No responsibility can be accepted for losses that may result as a consequence of trading on the basis of this analysis.
Chris Vermeulen Archive |
© 2005-2022 http://www.MarketOracle.co.uk - The Market Oracle is a FREE Daily Financial Markets Analysis & Forecasting online publication.