


An Inflation Indicator to Watch, Part 3
Economics / Inflation Mar 11, 2018 - 03:23 AM GMTBy: F_F_Wiley

“During the 1980s and 1990s, most industrial-country central banks were able to cage, if not entirely tame, the inflation dragon.”
—Ben Bernanke
Ben Bernanke began his oft-cited “helicopter speech” in 2002 with a few kind words about his peers, including the excerpt above. Speaking for central bankers, he took a large share of the credit for the low inflation of the 1980s and 1990s. Central bankers had gained a “heightened understanding” of inflation, he said, and he expected the future to bring even more inflation-taming success.
Of course, Bernanke’s cohorts took a few knocks in the boom–bust cycle that followed his speech, but their reputations as masters of inflation (and deflation) only grew. Today, the picture he painted seems even more firmly planted in the public mind than it was in 2002, notwithstanding recent data showing inflation creeping higher.
Public perceptions aren’t always accurate, though, and public figures aren’t the most reliable arbiters of credit and blame. In this 3-part article, I’m proposing a theory that challenges Bernanke’s narrative, and I’ll back the theory with data in Part 3. I’ll show that it leads to an inflation indicator with an excellent historical record.
But first, let’s recap a few points I’ve already discussed.
The Endless Tug-of-War
In Part 2, I said inflation depends on a tug-of-war between purchasing power (on the demand side) and capacity (on the supply side), and the war takes place within the circular flow, in which spending flows into income and income flows back to spending. Two circular-flow patterns and their causes demand particular attention:
- When banks inject money into the circular flow in the process of making loans, they can boost spending above the prior period’s income, thereby fattening the flow (or the opposite in the case of a deleveraging).
- When foreign imports exceed exports, spending might not adequately recycle back to income, opening a leak in the flow (or the opposite in the case of a trade surplus).
Those points might sound obvious to some (if not, they might look obvious in the diagrams included in Parts 1 and 2), but they’re inconsistent with mainstream economics. According to models favored by mainstream academics and central bankers, the circular-flow pattern involving bank-created money doesn’t exist. In other words, my way of thinking yields conclusions that you don’t find in mainstream theory or at, say, the Fed.
In particular, I’m proposing a circular-flow inflation indicator that consists of bank-created money, the trade balance and real GDP growth. As described in the bullets above, bank-created money and the trade balance measure injections to and leaks from the circular flow—they tell us whether injections and leaks could be upsetting the balance between purchasing power and capacity—while real GDP growth approximates capacity. Using “M63” for bank-created money (see Part 1 for further explanation), the exact inflation indicator is M63 growth plus the trade balance as a percent of GDP minus real GDP growth.
History’s Pages
To be sure, this is a high-level indicator—it should help predict major trends, not month-to-month volatility. When I tested it against history, I wanted to see if it explains inflation’s big-picture behavior in each business cycle, and it does exactly that, as I’ll demonstrate by comparing the indicator to core inflation over the last eight cycles. Here’s the core inflation data:
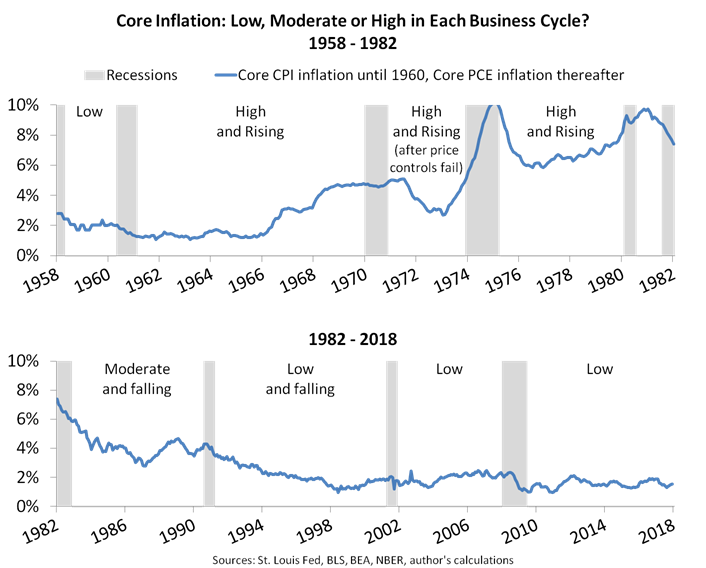
The chart shows why it makes sense to evaluate each business cycle as a separate event—namely, business-cycle recessions normally act as reset buttons, crushing inflation by constricting pricing power, which then sets the stage for the next expansion. So inflation begins a new life with each expansion, and the chart shows the differences from one to the next. To keep it simple, I assigned each of the business cycles to one of three inflation categories (low, moderate and high), and I also noted whether inflation was rising or falling relative to the previous cycle.
My first test, then, is to track the paths followed by the circular-flow indicator during three cycles plagued by high inflation:
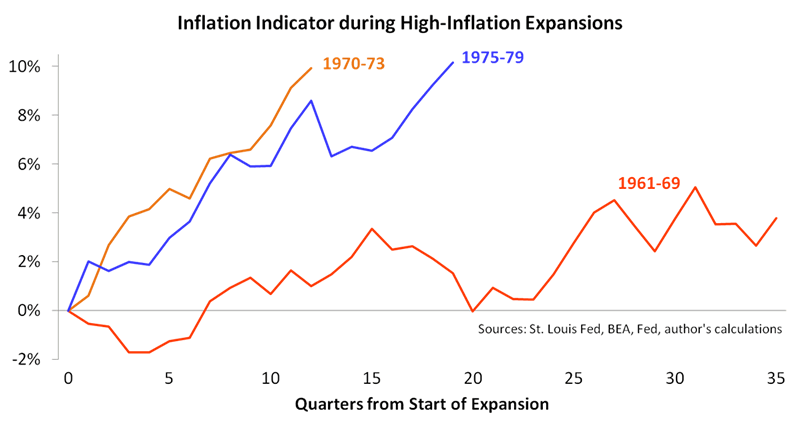
As you can see, the indicator went three for three, climbing higher during all three cycles. In circular-flow speak, there was too much purchasing power chasing too few goods. Anyone who had followed the indicator during those periods—basically, the 1960s and 1970s—would have expected the inflation dragon to fly free and been on the money.
But what about the five cycles marked by disinflation or low inflation?
Here are the indicator readings during those cycles:
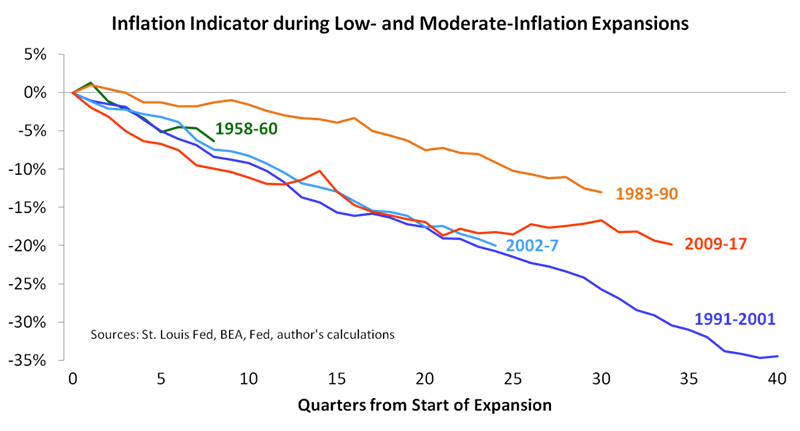
Once again, the indicator had a perfect record—five for five in predicting the inflation dragon was caged and then being proven correct. In each period of disinflation or low inflation, purchasing power was either losing or at a stalemate in the tug-of-war with capacity, and that continues today, although the trend turned sideways during the last three years. The recent turn from downward to sideways doesn’t tarnish the indicator’s historical performance—which I would call stellar—but if it turns upward from here that would become a cause for concern.
Notice also that core inflation jumped above the Fed’s current 2% target at some point during every expansion. In other words, core inflation can be volatile regardless of the circular-flow indicator’s direction. In fact, recent trends in monthly data place core CPI inflation above 2% again by spring or early summer, and core PCE inflation could follow. I mention this because I don’t want readers misinterpreting the charts above, which don’t preclude inflation continuing to fuel financial volatility as during the past month.
Conclusions
More to the point, the indicator bears watching as investors wonder if the recent inflation scare will be contained. It isn’t the only way to evaluate inflation risks, but there’s much to recommend it. I would say it fits the data like caroling fits Christmas, it’s as logical as giving thanks on Thanksgiving, and it supplies information not included in traditional indicators—like Groundhog’s Day but without the nonsense.
And that’s not all—the circular flow analysis I’ve proposed can also shine a cold light on stories told by mainstream economists. I discussed two of those stories earlier in this article—the Monetarist story and the story of central bank omnipotence—and I have a few concluding comments on each.
Monetarism. As discussed in Part 1, Monetarism enjoys nowhere near the popularity it reached in the late 1970s, despite a small tribe of modern-day descendents who continue to fixate on monetary aggregates such as M2. In my opinion, the 1970s Chicago Monetarists were like the 1990s Buffalo Bills—that is, they came oh so close. (Did you think I was going to call them wide right?) They had plenty of research proving the importance of money creation by banks, but they chose to preserve the mainstream narrative that banks are conduits, not creators, of the “initial monetary impulse.” If all of their eggheads hadn’t crammed into the same M2 basket, their popularity might not have fizzled out as it did.
Not only that, but circular-flow analysis such as mine would be standard fare if heterodox (and more realistic) thinking about money creation had forced its way into the mainstream before it became too late, shut off by powerful economists who built careers and reputations on orthodox theory alone. Again, 1970s Monetarism opened a window of opportunity but failed to climb through it—it was foiled by misconceptions about money and banking. (For a more thorough discussion on this topic, see my recently published book, Economics for Independent Thinkers, which applies circular-flow concepts to various issues in economics.)
Central Bank omnipotence. I recommend being wary of economists claiming to have everything figured out, whether they claim to have tamed the business cycle or, our topic here, inflation. The economy isn’t an animal or a motor vehicle or any of the other analogies that suggest a designated expert can control it, and the inflation outcomes of the last three decades weren’t engineered in an economics lab somewhere deep in the Eccles Building. On the contrary, it might be perfectly normal for inflation to trend toward low single digits—without central bank intervention—when a large trade deficit diverts purchasing power overseas, foreigners fail to inject that purchasing power cleanly back into America’s circular flow, and commercial banks refrain from rampant money creation. (Okay, banks have sometimes acted stupidly, but not by enough to offset trade-related deflationary forces, as shown in the last chart above.)
In other words, the Fed was probably more lucky than skillful, and it certainly wasn’t omnipotent.
Finally, inflation surfs the same waves stocks and bonds surf, but on the opposite phase (with exceptions, of course, such as TIPS), suggesting the circular-flow indicator can also help investors create their own luck. In future commentaries, I’ll make recommendations for applying it to economic and capital market forecasting. In particular, look for research supporting our bond outlook, which should give you another reason to swim away from the mainstream. Who knows? Adjusting your stroke for the circular-flow indicator might make a late but lucrative New Year’s resolution.
F.F. Wiley
F.F. Wiley is a professional name for an experienced asset manager whose work has been included in the CFA program and featured in academic journals and other industry publications. He has advised and managed money for large institutions, sovereigns, wealthy individuals and financial advisors.
© 2018 Copyright F.F. Wiley - All Rights Reserved
Disclaimer: The above is a matter of opinion provided for general information purposes only and is not intended as investment advice. Information and analysis above are derived from sources and utilising methods believed to be reliable, but we cannot accept responsibility for any losses you may incur as a result of this analysis. Individuals should consult with their personal financial advisors.
© 2005-2022 http://www.MarketOracle.co.uk - The Market Oracle is a FREE Daily Financial Markets Analysis & Forecasting online publication.