Here Is The Most Ridiculous Commentary About The Stock Market
Stock-Markets / Stock Markets 2018 Feb 26, 2018 - 02:48 PM GMTBy: Avi_Gilburt
 Whenever I write a new article on the stock market, I usually try to highlight just how ridiculous much of the commentary about the market truly is. My ultimate goal is to force you to think on your own and adopt a more intellectually honest perspective of financial markets, rather than just buying into anything you read or hear.
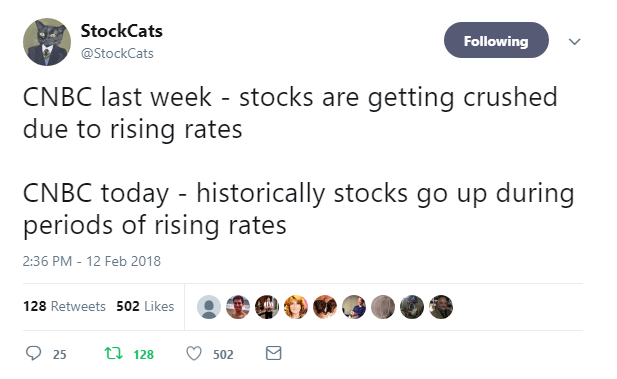
Two weeks ago, I noted how the pundits claimed the market dropped because of rising rates, but when the market rallied, the same pundits claimed that it was rallying because of rising rates.

Clearly, these people no longer think before they provide “analysis.” Yet, many viewers do even less thinking. Not only do they buy into everything they hear from these pundits, but they then come onto the comment section of my articles (and throughout blogs all over the internet) and regurgitate what they have just heard. It seems no one thinks on their own anymore.
Around the same time, these same pundits told us that if the CPI would suggest inflation is rearing its ugly head, the market would continue to tank. Yet, the market held the support I noted to my subscribers to the penny, and we have continued higher still. So, I guess inflation must be good for the market.
So, I happened to have had the television turned on Friday to a certain news station towards the end of the trading day. And, I am usually quite amused at hearing what the “experts” say about what is causing the day’s movements in the market.
Now, on Friday, there was no real news that the pundits could point towards which would explain the rally we experienced. However, it seems the first pundit decided to view the rally as being caused by Trump’s speech that afternoon. I mean, did he announce some amazing new economic stimulus that caused investors to begin buying with two fists? No. Maybe it was his perspective on how he tries to hide his bald spot? Somehow, I just don’t think that was it either. Yet, that did not stop the first pundit from claiming that this speech somehow caused the market to rally on Friday. And, amazingly, not only did none of the other 3 pundits on the same show challenge him on that perspective or come up with another perspective of their own, they all simply agreed that it must have been caused by Trump’s speech.
I think we have come to the point in time where we are not only confronted with “fake news,” but it seems we are constantly being confronted by “fake analysis.”
When I was in 3rd grade, my teacher had a sign up at the front of the room which stated: “PUT BRAIN IN GEAR BEFORE ENGAGING MOUTH.” Sadly, most of those who offer us financial analysis today do not abide by this simple guidance presented in my 3rd grade class.
So, let’s try and focus on the reality of the market rather than some of the ridiculous things that some people spout, which is based upon the news of the moment.
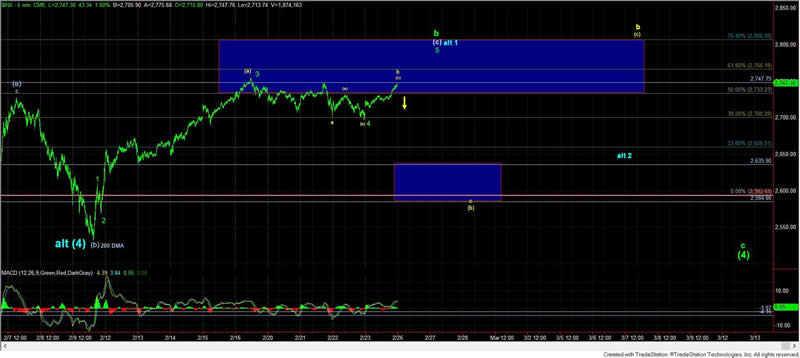
Last weekend, I noted to my subscribers that I expected a pullback during this past week. And, if we would break the 2700 level of support, then it would project us down to the 2600SPX region, and set up a rally to the 2800SPX region. However, I also noted that if the 2700SPX region held as support, the market could be taking a more direct path to our 2800SPX region target. Thus far, the 2700SPX region has held like a champ, and Monday will likely provide us with further clarification if we are heading directly up to the 2800SPX target we set weeks ago when we bottomed in the 2536SPX region.
In the coming week, the 2730SPX level seems quite prominent to me. As long as we hold over that level, the market seems to be targeting the 2800 region before the next bigger pullback/drop is seen, which is outlined in my green colored wave count below.

However, should we see the market break 2730SPX early in the week, and follow through below 2700SPX, then we have an open door to drop down to the 2600SPX region again, and likely quite fast, which is outlined in my yellow colored wave count below.
Ultimately, as I have noted many times before, I do not believe this bull market has yet completed. Rather, I still believe the next few months will be developing a base in the market from which we can rally to the 3011-3223SPX region next, which can still be seen by the end of 2018 or early 2019. A sustained break down below 2400SPX would make me reconsider this potential for 2018.
Lastly, for those who struggle with my if/then analysis progression, I want to remind you of something. The stock market is a non-linear environment, which means we have to approach it from a probabilistic perspective. We use standard patterns which guide us in identifying changed trends in market sentiment and investor psychology.
These patterns provide us accurate targets, along with intermediate term targets and support levels along the progression through the pattern. As long as a particular pattern maintains within its parameters, we maintain our higher targets. However, if we see evidence that the pattern is not following through appropriately, we have an alternative perspective which we immediately adopt. This allows us early warning for a turn in the market, which then allows us for more than enough opportunity to be able to adjust our positioning.
As Keynes purportedly said:
“When the facts change, I change my opinion. What do you do sir?”
Remember, nothing hurts a portfolio more than this four-letter word: HOPE.
See charts illustrating the wave counts on the S&P 500.
Avi Gilburt is a widely followed Elliott Wave technical analyst and author of ElliottWaveTrader.net (www.elliottwavetrader.net), a live Trading Room featuring his intraday market analysis (including emini S&P 500, metals, oil, USD & VXX), interactive member-analyst forum, and detailed library of Elliott Wave education.
© 2018 Copyright Avi Gilburt - All Rights Reserved Disclaimer: The above is a matter of opinion provided for general information purposes only and is not intended as investment advice. Information and analysis above are derived from sources and utilising methods believed to be reliable, but we cannot accept responsibility for any losses you may incur as a result of this analysis. Individuals should consult with their personal financial advisors.
© 2005-2022 http://www.MarketOracle.co.uk - The Market Oracle is a FREE Daily Financial Markets Analysis & Forecasting online publication.


