


Stocks Break Higher but Their Rally May Fade
Stock-Markets / Stock Markets 2018 Feb 26, 2018 - 02:42 PM GMTBy: Paul_Rejczak

 Stocks rallied on Friday, but they remained within their week-long consolidation. Which direction is next? Will bulls drive prices higher this week? Or will Friday's move up fade today? The S&P 500 index continues to trade along the level of 2,700-2,750, and it is still around 4.4% below its late January all-time high. Stocks are expected to open higher today, but will they continue upwards after 9:30 a.m.?
The main U.S. stock market indexes went 1.4-1.8% higher in Friday's trading session, as investors' sentiment improved following week-long fluctuations after previous week's rally off February 9 lows. The S&P 500 index got close to its recent local highs and it currently trades around 4.4% below January 26 record high of 2,872.87. It retraced more than 61.8% of its late January - early February sell-off (retracement level at 2,742.92). The Dow Jones Industrial Average gained 1.4%, and the technology Nasdaq Composite gained 1.8% on Friday.
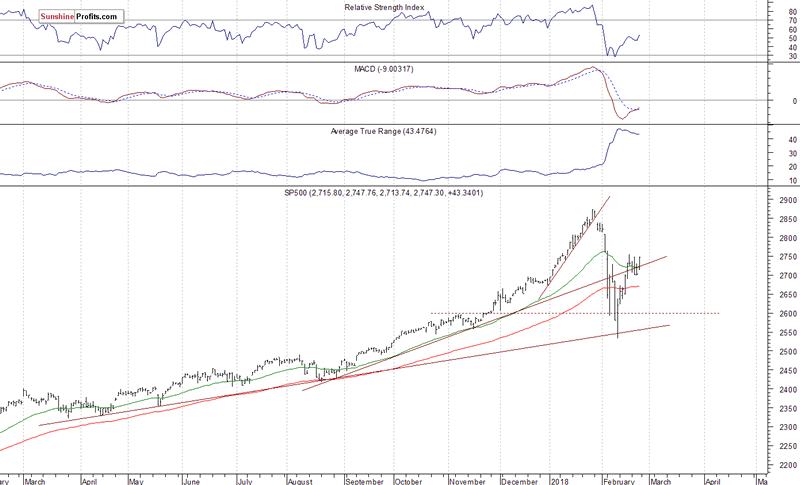
The nearest important level of resistance of the S&P 500 index remains at around 2,750, marked by recent local highs. The resistance level is also at 2,760-2,765. On the other hand, support level is at 2,700, marked by local lows. If the market continues higher, potential resistance level would be at around 2,800-2,810, marked by the late January short-term consolidation.
The S&P 500 index reached its record high almost a month ago on January 26. It broke below month-long upward trend line, as it confirmed uptrend's reversal. Then the broad stock market gauge retraced all of its January rally and continued lower. The index extended its downtrend on February 9, as it was almost 12% below the late January record high. We can see that stocks reversed their medium-term upward course following whole retracement of last month's euphoria rally. However, the market bounced off its almost year-long medium-term upward trend line, and it retraced more than 61.8% of the sell-off within a few days of trading. Is this just an upward correction or uptrend leading to new all-time highs? It still looks like an upward correction, but the index is much closer to breaking above its short-term consolidation:
Positive Expectations Again
The index futures contracts gain 0.3-0.6% vs. their Friday's closing prices this morning. It means that investors' expectations ahead of the opening of trading session are positive again. The European stock market indexes have gained 0.3-0.5% so far. Investors will wait for the New Home Sales number release at 10:00 a.m. Will the market continue higher after the opening of cash market's trading session? The S&P 500 index is expected to break above its week-long consolidation today, unless sentiment worsens before 9:30 a.m.
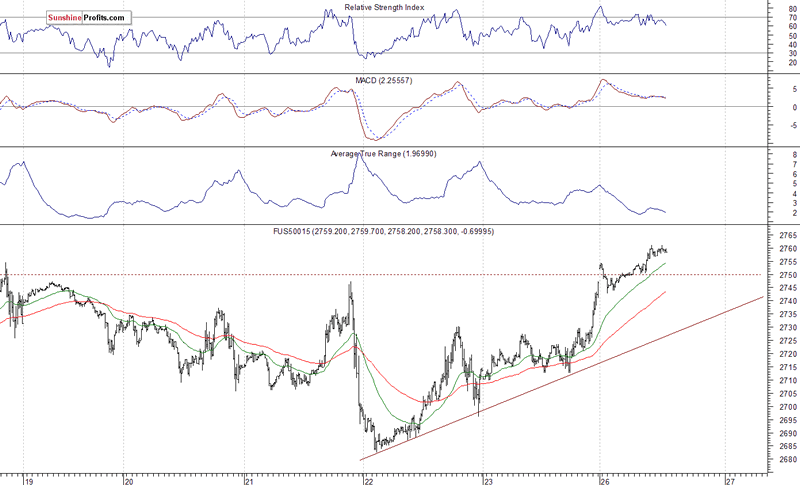
The S&P 500 futures contract trades within an intraday uptrend, as it extends its Friday's advance. It broke above the resistance level of 2,750. The next important level of resistance is at around 2,780-2,800, among others. On the other hand, support level remains at around 2,745, marked by some short-term local lows. There is also a support level of 2,735-2,740, marked by last week's local highs. The futures contract trades above its upward trend line, as we can see on the 15-minute chart:
Nasdaq Above Last Week's Consolidation
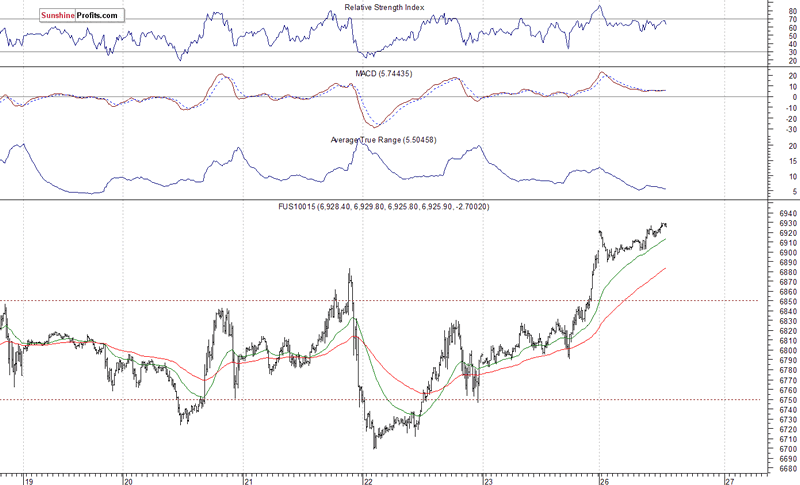
The technology Nasdaq 100 futures contract follows a similar path, as it trades within an intraday uptrend. The market broke above its week-long fluctuations along the level of 6,800. It currently trades above 6,900 mark. Potential resistance level is at 7,000-7,050, marked by the late January all-time high. On the other hand, support level is at 6,890-6,900, and the next level of support is at 6,850-6,870, marked by last week's consolidation. Will technology index get back above 7,000 mark and continue towards new record highs? The Nasdaq futures contract trades above its last week's short-term consolidation, as the 15-minute chart shows:
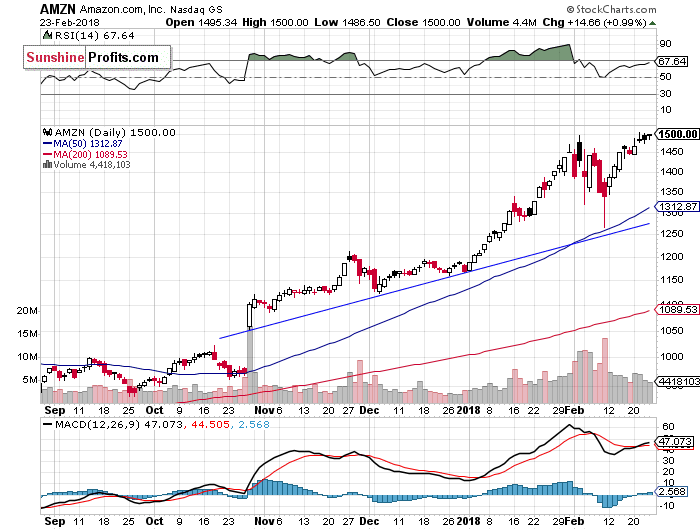
Apple Breaks Higher, Amazon at Record High
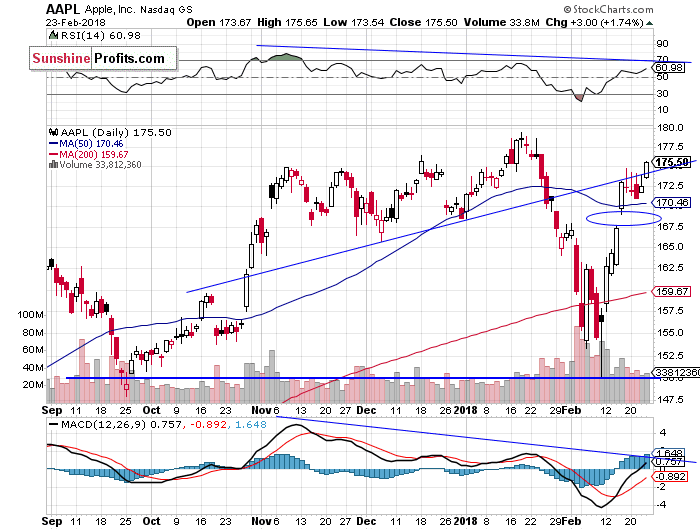
Let's take a look at Apple, Inc. stock (AAPL) daily chart (chart courtesy of http://stockcharts.com). It was one of the recent stock market rout's main drivers. Then it led broad stock market rebound rally. It fell close to support level of $150 on February 9. Since then, it was retracing most of the early February losses. The market reached its previously broken upward trend line. Will it break above the resistance level of $175-180? It could continue towards new record highs:
Amazon.com, Inc. stock (AMZN) continues to be relatively strong vs. the broad stock market. It reached new record high on Wednesday, as it broke above $1,500 mark. The stock continues to trade well above its end of year closing price of $1,167.5. AMZN bounced off its upward trend line more than two weeks ago, following downward correction below the price of $1300. It currently trades within a relatively narrow trading range along new record high. We can see some negative technical divergences However, there have been no confirmed negative signals so far:
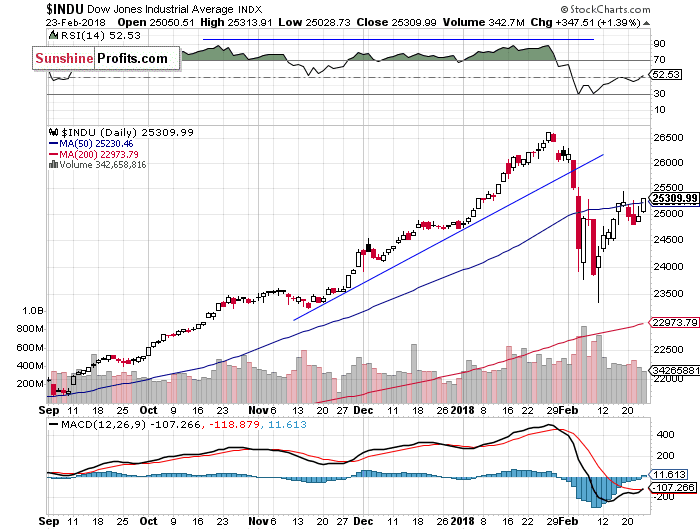
The Dow Jones Industrial Average daily chart shows that blue-chip index reversed its uptrend a month ago. The price broke below the level of 26,000 and continued much lower. There were some medium-term negative technical divergences - the most common divergences are between asset’s price and some indicator based on it (for instance the index and RSI based on the index). In this case, the divergence occurs when price forms a higher high and the indicator forms a lower high. It shows us that even though price reaches new highs, the fuel for the uptrend starts running low.
The DJIA fell below 23,500 on Friday two weeks ago. We saw positive candlestick chart pattern that day. The market formed bullish harami. It is a pattern in which a large black candlestick is followed by a smaller white candlestick with body located within the body of a preceding day. Since then, it continued higher. The market got closer the resistance level of around 25,500 again. Will it continue higher today? So far, it remains below its recent local high:
Concluding, the S&P 500 index rallied 1.6% on Friday, as it got closer to recent local highs again. The broad stock market is expected to continue higher today, unless investors' sentiment worsens before the opening of the cash market's trading session. Investors took some short-term profits off the table last week, but they resumed buying stocks on Friday. The market is still more than 4% below month-long record high, so it didn't retrace all of its late January - early February sell-off. Will it come back to record high? It is hard to say, but we can see some bullish pressure, as investors' sentiment improves following economic data, quarterly earnings releases. Stocks are expected to open higher today, but we may see short-term profit taking at some point.
The broad stock market was falling almost 12% off its late January record high on Friday, February 9 before an intraday reversal. It was a final panic selling ahead of short-term upward reversal, and the market found a support of its medium-term upward trend line, which was at 2,550. The index extended its week-long rebound almost a week ago on Friday, and it continued slightly above 61.8% retracement of the sell-off.
The S&P 500 index retraced its whole month-long January rally and fell the lowest since early October. Then it retraced more than 61.8% of this relatively quick and deep sell-off. So, medium-term picture is now slightly bearish. Investors took profits off the table following the unprecedented month-long rally, but then they began selling in panic. It was quite similar to 2010 Flash Crash event. Is this just downward correction or the beginning of a new medium-term downtrend? This sell-off set the negative tone for weeks or months to come, despite recent broad stock market rebound.
If you enjoyed the above analysis and would like to receive free follow-ups, we encourage you to sign up for our daily newsletter – it’s free and if you don’t like it, you can unsubscribe with just 2 clicks. If you sign up today, you’ll also get 7 days of free access to our premium daily Gold & Silver Trading Alerts. Sign up now.
Thank you.
Paul Rejczak
Stock Trading Strategist
Stock Trading Alerts
SunshineProfits.com
Stock market strategist, who has been known for quality of his technical and fundamental analysis since the late nineties. He is interested in forecasting market behavior based on both traditional and innovative methods of technical analysis. Paul has made his name by developing mechanical trading systems. Paul is the author of Sunshine Profits’ premium service for stock traders: Stock Trading Alerts.
* * * * *
Disclaimer
All essays, research and information found above represent analyses and opinions of Paul Rejczak and Sunshine Profits' associates only. As such, it may prove wrong and be a subject to change without notice. Opinions and analyses were based on data available to authors of respective essays at the time of writing. Although the information provided above is based on careful research and sources that are believed to be accurate, Paul Rejczak and his associates do not guarantee the accuracy or thoroughness of the data or information reported. The opinions published above are neither an offer nor a recommendation to purchase or sell any securities. Mr. Rejczak is not a Registered Securities Advisor. By reading Paul Rejczak’s reports you fully agree that he will not be held responsible or liable for any decisions you make regarding any information provided in these reports. Investing, trading and speculation in any financial markets may involve high risk of loss. Paul Rejczak, Sunshine Profits' employees and affiliates as well as members of their families may have a short or long position in any securities, including those mentioned in any of the reports or essays, and may make additional purchases and/or sales of those securities without notice.
Paul Rejczak Archive |
© 2005-2022 http://www.MarketOracle.co.uk - The Market Oracle is a FREE Daily Financial Markets Analysis & Forecasting online publication.