The Inflation Trade and Bond Yields Rising Result in Equities Correction
Stock-Markets / Financial Markets 2018 Feb 12, 2018 - 02:07 PM GMTBy: Abalgorithm
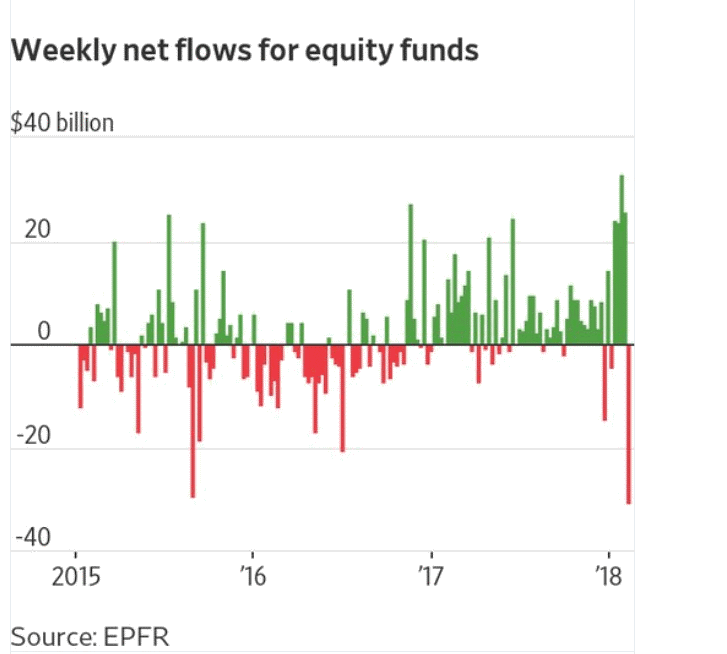
 The Dow has one of its biggest percentage weekly decline since 2008. The sudden return of volatility across global markets has triggered the biggest stampede out of equity funds on record. Investors yanked a net $30.6 billion out of equity funds in the week through Wednesday, according to fund tracker EPFR Global. That’s the largest weekly net outflow based on data going back to 2004, based on Bank of America Merrill Lynch analysis of EPFR data. The exodus out of stock funds wasn’t a global phenomenon. Asia benefited from fund flows in the latest week to Feb. 7, even as major indexes there tumbled too. Investors poured a net $4.7 billion into Japanese equity funds alone, the biggest weekly inflow since November 2016, the data show. Investors also sent a net $528.5 million into South Korean stock funds, the largest weekly influx this year.
Emerging-market stock funds benefited from their ninth straight week of net inflows, even though the net injection of cash moderated. For sure, the EPFR data doesn’t take into account the market action on Thursday and Friday this week.
The last week saw more than 30 bn coming out of equity assets.

It could get a lot worse as money flowing out has a cascading effect. The sharp swings appear to have especially spooked investors in funds tied to U.S. stocks, which have soared for the past nine years and blown through a series of record highs. Investors pulled a net $33 billion out of North American equity funds in the week through Wednesday, the biggest weekly outflow based on data going back to 2015, according to EPFR.
What could have led to such a drastic cut in equity markets
The cut in equity markets were expected. Inflation cycles were starting to pickup across emerging markets with central bankers on record about rate hikes. Even the normally reticent BoJ has been neutral on inflation from being skeptical about inflation pickup. The more hawkish central banks have said there can be rise in fed rates during 2018. This has resulted in the 10 year yield for US treasury, Australian bonds, Indian bonds and japanese bonds to have reacted upwards. When yields move higher, equity markets cannot maintain the same momentum as before. Market position change from a consumer focussed to commodity focussed markets. Market distribution from one sector to another will entail correction which is what we saw last 2 weeks. The next leg of the move will be commodities moving higher.
Dollar Index

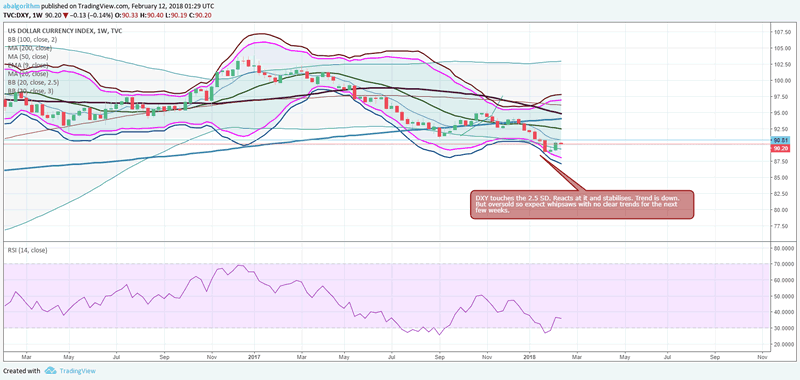
The dollar index after hitting the 2.5SD of 20 weeklyBB band has now stabilised. No clear trend available. So range trading expected.
US10 Year yield

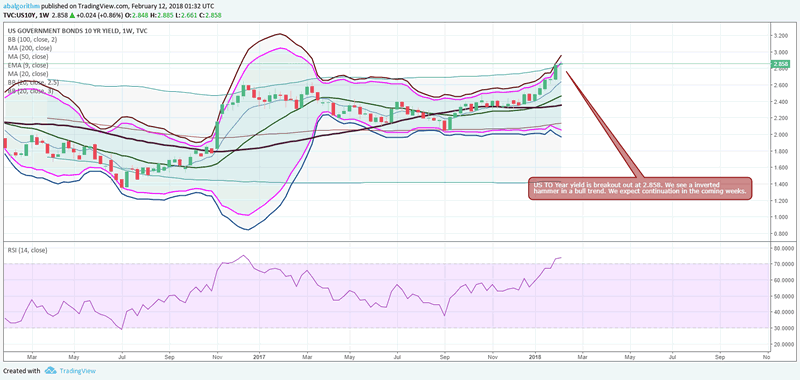
The 1o year yield is breaking out at 2.865%. Inverted hammer suggests upward continuation. This also means the equity bull run is now limited. Yields on 10-year Treasury bonds are still very low by historical standards at about 2.85 per cent, but they have risen enough to force a rethink about equity valuations. Low yields on bonds during the post-crisis era, stemming from intervention by central banks to keep interest rates low, have been a key part of the “bull case” for equities, and prompted investors to invest in stocks in search of a yield from their dividends. (Source: FT)

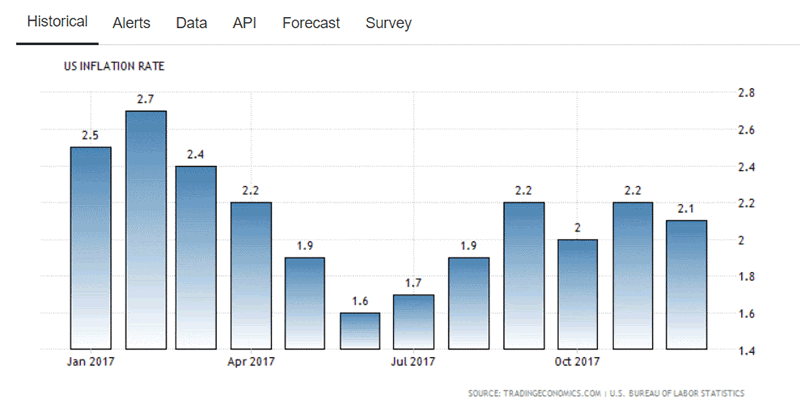
US Inflation fears are returning as the trend is again moving higher. CPI is 2.1% yearly. Consumer prices in the United States increased 2.1 percent year-on-year in December of 2017, easing from a 2.2 percent rise in November. Figures came below market expectations of 2.2 percent amid a slowdown in gasoline and fuel prices. However traders are betting that the slight below reading does not dent the broader trend of higher prices in the economy are here to stay. This is further confirmed by the pickup in bond yields.
Anyone with a MT4 account can trade our trade copier. Please reach out to us via filling the form: Contact for TradeCopier
About Us
abalgorithm.com is a quant based research and trading firm. We operate a high performance FX trade copier service which uses Machine Learning as its core. You can check the results here: TRADE COPIER 3 MONTHS REPORT: +53%
More performance reports
In addition, we operate a LIVE TRADE ROOM along with daily indepth research and manual trade calls. Clients and guests can have a lively discussion of the state of the world economy and trading opportunities.
To join our trade copier: Fill the form
About Abalgorithm.com
Abalgorithm operates an automated quant forex trade copier and a live trade room for clients who trade forex. We also provide daily research on equities, bonds, ETF, commodities. We are located at http://abalgorithm.com
© 2018 Copyright Abalgorithm - All Rights Reserved Disclaimer: The above is a matter of opinion provided for general information purposes only and is not intended as investment advice. Information and analysis above are derived from sources and utilising methods believed to be reliable, but we cannot accept responsibility for any losses you may incur as a result of this analysis. Individuals should consult with their personal financial advisors.
© 2005-2022 http://www.MarketOracle.co.uk - The Market Oracle is a FREE Daily Financial Markets Analysis & Forecasting online publication.


