Most Popular
1. It’s a New Macro, the Gold Market Knows It, But Dead Men Walking Do Not (yet)- Gary_Tanashian
2.Stock Market Presidential Election Cycle Seasonal Trend Analysis - Nadeem_Walayat
3. Bitcoin S&P Pattern - Nadeem_Walayat
4.Nvidia Blow Off Top - Flying High like the Phoenix too Close to the Sun - Nadeem_Walayat
4.U.S. financial market’s “Weimar phase” impact to your fiat and digital assets - Raymond_Matison
5. How to Profit from the Global Warming ClImate Change Mega Death Trend - Part1 - Nadeem_Walayat
7.Bitcoin Gravy Train Trend Forecast 2024 - - Nadeem_Walayat
8.The Bond Trade and Interest Rates - Nadeem_Walayat
9.It’s Easy to Scream Stocks Bubble! - Stephen_McBride
10.Fed’s Next Intertest Rate Move might not align with popular consensus - Richard_Mills
Last 7 days
Stocks Bull Market End Game Bear Start Strategy - 20th Mar 25
Gold and System Collapse: Charting the Bank Run of the Mighty US Dollar - 20th Mar 25
Tesla's Troubles — Is it Musk or is it More? - 20th Mar 25
The Stock Market Bear / Crash indicator Window - 9th Mar 25
Big US Tech Stocks Fundamentals - 9th Mar 25
No Winners When The Inflation Balloon Pops - 9th Mar 25
Stocks, Crypto and Housing Market Waiting for Trump to Shut His Mouth! - 27th Feb 25
PepeCoin (PEPE): Anticipating Crypto Reversals using Elliott Waves - 27th Feb 25
Audit the Fed, Audit Fort Knox, Audit Everything - 27th Feb 25
There Are Some Bullish Indicators in the Silver Market - 27th Feb 25
These Metrics Identify Only 10 AI Related Stocks That Are Undervalued - 27th Feb 25
Stocks, Bitcoin, Gold and Silver Markets Brief - 18th Feb 25
Harnessing Market Insights to Drive Financial Success - 18th Feb 25
Stock Market Bubble 2025 - 11th Feb 25
Fed Interest Rate Cut Probability - 11th Feb 25
Global Liquidity Prepares to Fire Bull Market Booster Rockets - 11th Feb 25
Stock Market Sentiment Speaks: A Long-Term Bear Market Is Simply Impossible Today - 11th Feb 25
A Stock Market Chart That’s Out of This World - 11th Feb 25
These Are The Banks The Fed Believes Will Fail - 11th Feb 25
S&P 500: Dangerous Fragility Near Record High - 11th Feb 25
Stocks, Bitcoin and Crypto Markets Get High on Donald Trump Pump - 10th Feb 25
Bitcoin Break Out, MSTR Rocket to the Moon! AI Tech Stocks Earnings Season - 10th Feb 25
Liquidity and Inflation - 10th Feb 25
Gold Stocks Valuation Anomaly - 10th Feb 25

Market Oracle FREE Newsletter

How to Protect your Wealth by Investing in AI Tech Stocks

Bitcoin’s $10,000 "Line in the Sand"

Currencies / Bitcoin Jan 31, 2018 - 04:08 PM GMT

By: EWI

Currencies


The cryptocurrency's trends continue to be fueled by investor psychology

On January 23, Bitcoin fell below $10,000. That's the second time in recent days that prices dipped below this psychologically important threshold. The headlines picked up on the drama:

"Bitcoin tumbles below $10,000 and is now down 25% on the year..." (CNBC, Jan 23)


That same article also observed:

"No specific driver was immediately apparent behind Tuesday's decline..."

The driver was investor psychology. That's something Elliott waves analysis is adept at helping you track and forecast, so let's see what the waves had to say about Bitcoin's latest slide.

The day before the drop, our Cryptocurrency Pro Service posted this chart and a bearish forecast (partial Elliott wave labels shown):

Bottom Line: Multiple [Elliott] wave counts warn XBT is headed lower.

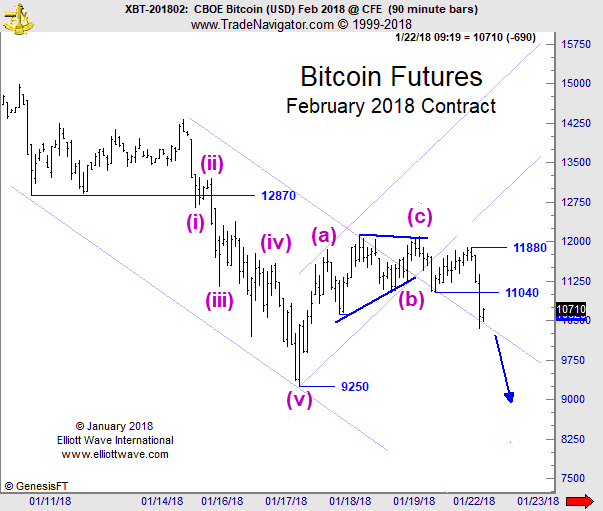
(Last Price 10710): The decline below 11,040 signals that the recent correction is likely complete. There are two ways to count it. Wave iv might have ended... or we can count [a still-unfolding wave iv triangle]... Both [wave counts] warn the risk is to the downside...

Early the next day, Bitcoin fell to $9,910. Here's what the price action has looked like since (partial Elliott wave labels shown):

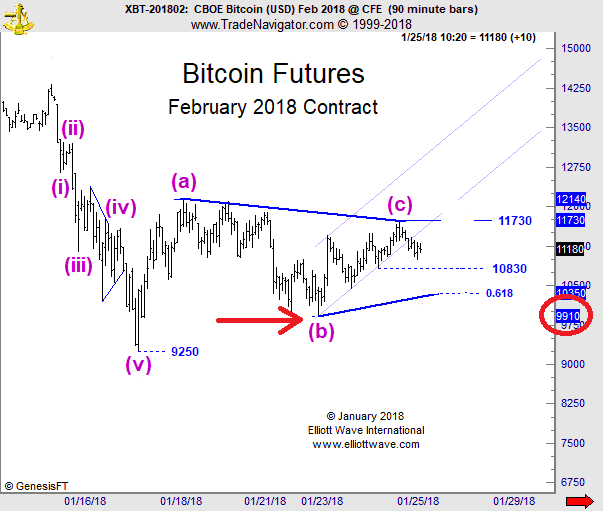
Keep in mind that sideways market moves are almost always corrective. Meaning that, most likely, Bitcoin's "wave iv" our January 22 analysis mentioned above is still developing -- as an Elliott wave pattern called a "contracting triangle."

If you know Elliott, you know exactly what this wave labeling implies.

[FREE REPORT] Bitcoin: The Greatest Bubble of All Time

As you read the news that Bitcoin dropped "below $10,000 with $36 billion of value wiped off in a day..." (CNBC, Jan. 17), you're probably asking,

"What's next for Bitcoin and other cryptos?"

Our new, free report gives you some much-needed answers.

Learn how to get free, instant access to this resource.

This article was syndicated by Elliott Wave International and was originally published under the headline Bitcoin’s $10,000 "Line in the Sand". EWI is the world's largest market forecasting firm. Its staff of full-time analysts led by Chartered Market Technician Robert Prechter provides 24-hour-a-day market analysis to institutional and private investors around the world.


© 2005-2022 http://www.MarketOracle.co.uk - The Market Oracle is a FREE Daily Financial Markets Analysis & Forecasting online publication.


Post Comment

Only logged in users are allowed to post comments. Register/ Log in