Stocks are Down, VIX is Higher, But No Signal This Morning
Stock-Markets / Stock Markets 2018 Jan 29, 2018 - 03:34 PM GMT Good Morning!
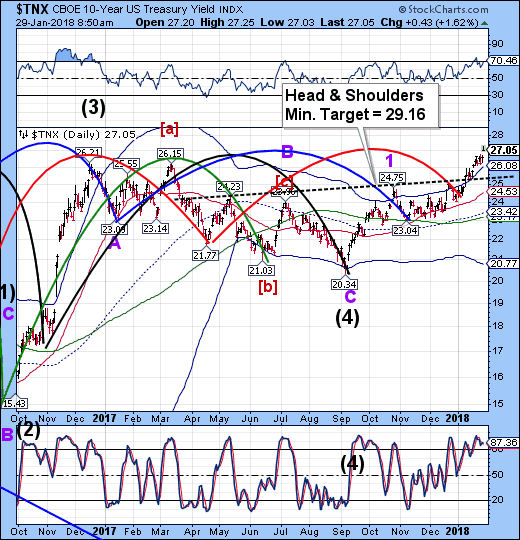
TNX futures are higher this morning as to blows out prior resistance levels into a clear Wave (5) rally that is still in its early stages. It is approaching its Weekly Cycle Top resistance at 27.80, but is likely to blow through it. The Head I Shoulders pattern usually indicates the terminus of Wave 3. The Monthly Cycle Top is near 35.00 and may be the ultimate target of this final Primary Wave [1] off its all-time low.
ZeroHedge reports, “The recent frantic moves in Treasurys and the dollar continued on Monday as we enter what is set to be a juggernaut of a "rollercoaster week", and while the dollar collapse seems to have slowed for now, this is as a result of an acceleration in the Treasury selloff, with 10Y yields blowing out to 2.72% for the first time since early 2014, and now deep into what Jeff Gundlach called the "danger zone" for equities.”
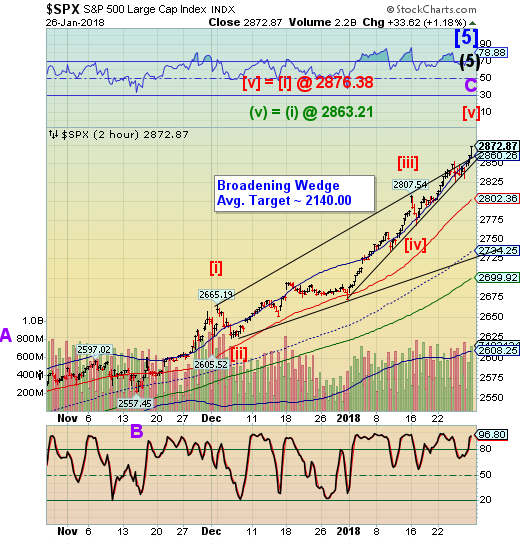
SPX futures are lower this morning. They must decline beneath the Cycle Top at 2860.26 to conclude the rally. A sell signal is likely to happen as SPX crosses its lower Ending Diagonal trendline at 2850.00 or the VIX breaks out. Today is 256 of the (258-day) Master Cycle and with it, SPX is expected to break down this week.
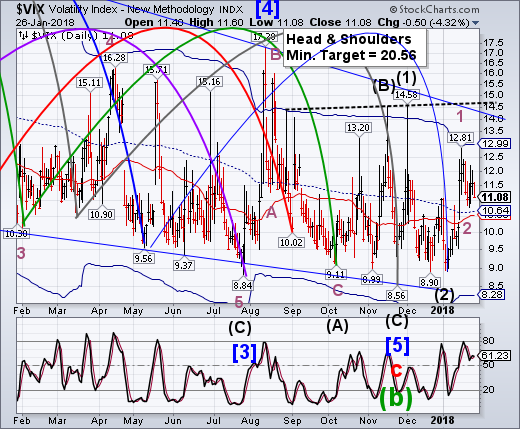
VIX futures are noticeably higher this morning, but haven’t yet broken out. A breakout may occur either at the prior high of 12.81 or the Cycle Top resistance at 12.99. I prefer the latter since there is a lesser chance of a pullback. As it stands, there is a high likelihood of Wave 1 ending at the neckline instead of its current position in an orderly market. However, we have been warned that the VIX may become very disorderly once it breaks out above resistance.
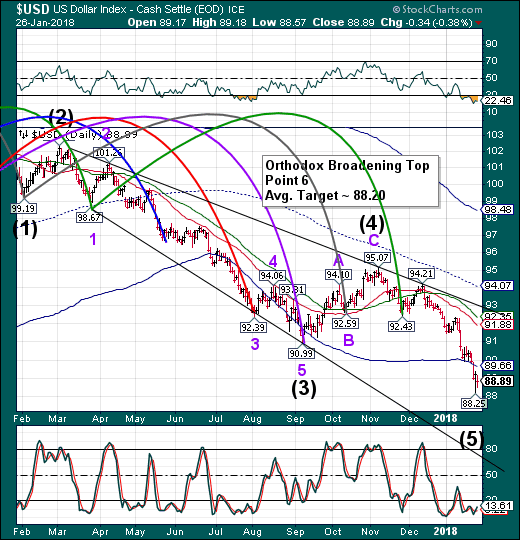
USD futures have bounced over the weekend with a high at 89.26. However, the Cycles Model suggests yet another week of decline. A close above the Cycle Bottom at 89.66 suggests the decline may be over, but as long as it stays beneath that level, the Cycles Model suggest another possible bearish move.
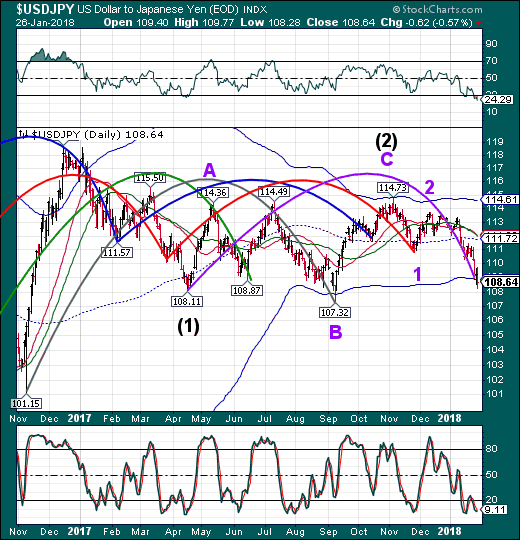
USD/JPY appears to be hovering at its Cycle Bottom support. However, the declining Wave structure does not appear complete. The Cycles Model forecasts yet another week of decline for both USD and USD/JPY.
Regards,
Tony
Our Investment Advisor Registration is on the Web.
We are in the process of updating our website at www.thepracticalinvestor.com to have more information on our services. Log on and click on Advisor Registration to get more details.
If you are a client or wish to become one, please make an appointment to discuss our investment strategies by calling Connie or Tony at (517) 699-1554, ext 10 or 11. Or e-mail us at tpi@thepracticalinve4stor.com .
Anthony M. Cherniawski, President and CIO http://www.thepracticalinvestor.com
As a State Registered Investment Advisor, The Practical Investor (TPI) manages private client investment portfolios using a proprietary investment strategy created by Chief Investment Officer Tony Cherniawski. Throughout 2000-01, when many investors felt the pain of double digit market losses, TPI successfully navigated the choppy investment waters, creating a profit for our private investment clients. With a focus on preserving assets and capitalizing on opportunities, TPI clients benefited greatly from the TPI strategies, allowing them to stay on track with their life goals.
Disclaimer: The content in this article is written for educational and informational purposes only. There is no offer or recommendation to buy or sell any security and no information contained here should be interpreted or construed as investment advice. Do you own due diligence as the information in this article is the opinion of Anthony M. Cherniawski and subject to change without notice.
Anthony M. Cherniawski Archive |
© 2005-2022 http://www.MarketOracle.co.uk - The Market Oracle is a FREE Daily Financial Markets Analysis & Forecasting online publication.


