Stocks and Commodities Reached Significant Resistance Levels, May Signal End of the Rally
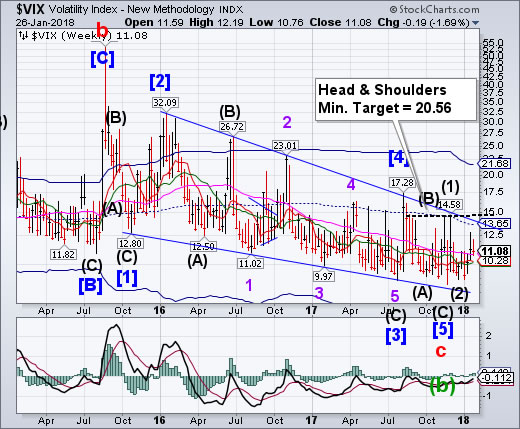
Stock-Markets / Financial Markets 2018 Jan 28, 2018 - 05:44 PM GMT VIX performed an inside consolidation, closing above Long-term support at 10.83 and on a buy signal. The calm may be broken. A breakout above the Ending Diagonal trendline suggests a complete retracement of the decline from January 2016, and possibly to August 2015.
(Bloomberg) Just as the rapper Curtis Jackson III captures attention for realizing he’s made millions on Bitcoin, the buyer of volatility options that shares his moniker is a window shopper in VIX options no longer.
Trading patterns associated with the trader dubbed “50 Cent” resurfaced on Friday as 50,000 March VIX calls with a strike price of 24 were purchased for 49 cents a pop.
SPX completes a “high five.”
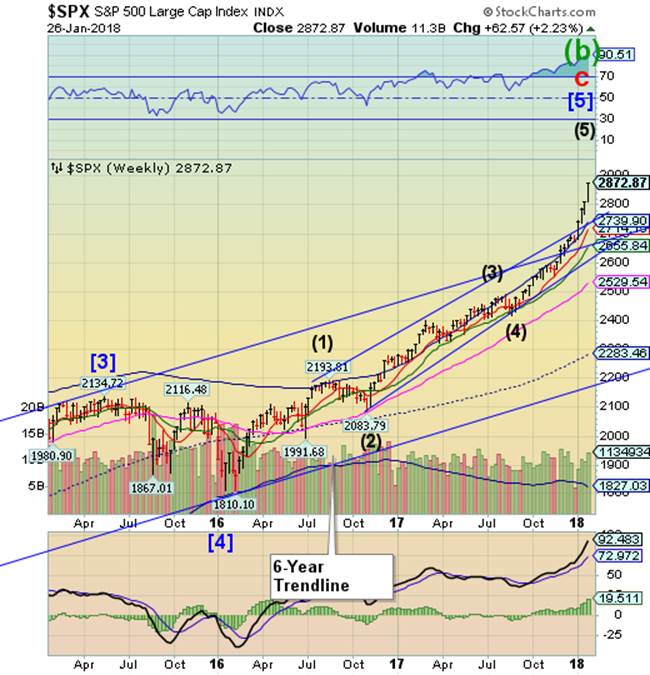
SPX extended its Wave (5) above the Ending Diagonal channel in a throw-over formation. A decline beneath its Cycle Top and upper Diagonal trendline at 2739.90 suggests the rally may be over and profits should be taken. A break of the Intermediate-term support at 2655.84 and the trendline nearby, generates a sell signal. Should that happen, we may see a sharp decline in the next two weeks or more.
(CNBC) U.S. stocks closed sharply higher on Friday as quarterly earnings top estimates, while the economy continues to grow.
The Dow Jones industrial average rose 223.92 points and hit intraday and closing records. The 30-stock index finished the session at 26,616.71.
The S&P 500 gained 1.2 percent to 2,872.87, with tech and health care as the best-performing sectors, and also reached an all-time high. The broad index also had its biggest one-day gain since March 1, 2017.
NDX throws over its Channel trendline.
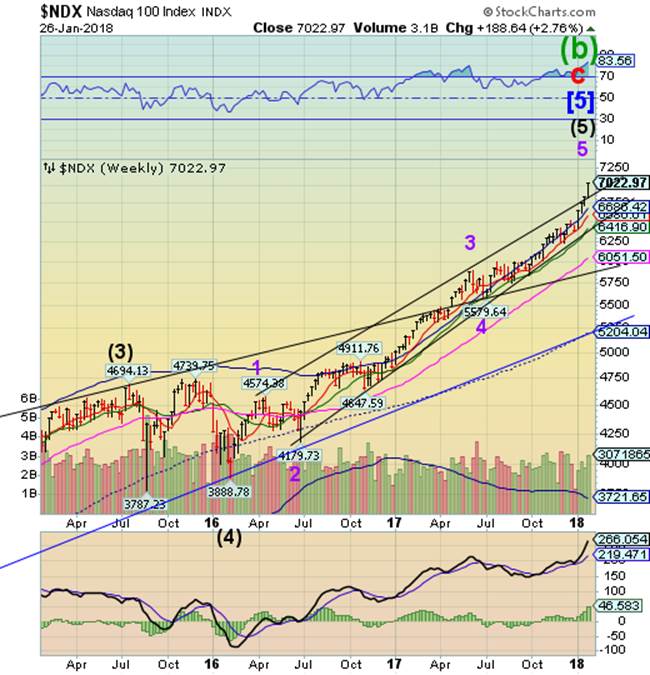
The NDX also extended the throw over of its Trading Channel trendline as well. A decline beneath the trendline at 6880.00 suggests that the rally may be over. A further decline beneath lower Diagonal trendline and Intermediate-term support at 6416.90 may produce a sell signal.
(ZeroHedge) Early last month, we showed that one of Bank of America's "guaranteed bear market" indicators, namely the three-month earnings estimate revision ratio (ERR) which since 1988 has had a 100% hit rate of predicting upcoming bear markets, was just triggered. As Bank of Americaexplained at the time, "since 1986, a bear market has followed each time that the ERR rule has been triggered."
The only weakness of that particular signal is that while a bear market has always followed, the timing was unclear and the bear could arrive as late as two years after its was triggered.
Well, fast forward to today when overnight another proprietary "guaranteed bear market" indicator created by the Bank of America quants was just triggered.
High Yield Bond Index regains momentum...
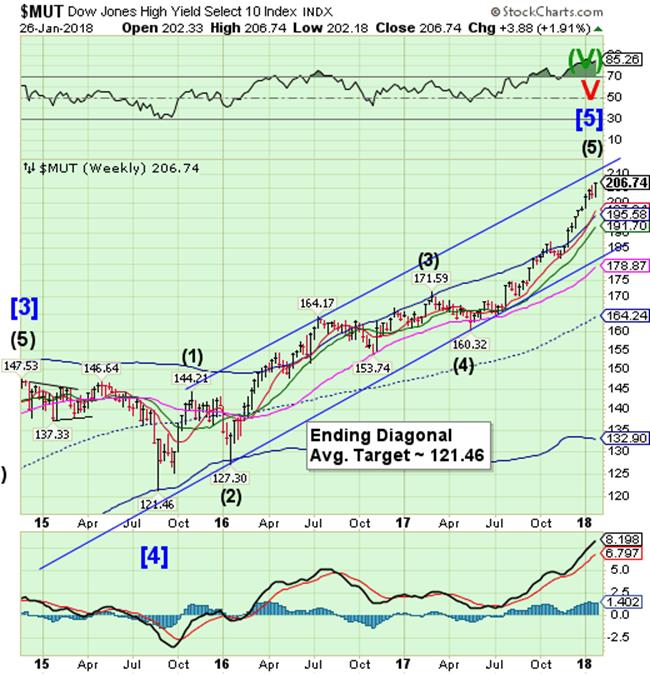
The High Yield Bond rall got a new lease on life as it made new all-time highs this week. It achieved a critical Fibonacci relationship on Friday which may indicate completion. Perhaps a reversal may be in the making?” While the trend is still up, a decline beneath the Cycle Top at 195.58 may indicate the rally is over.. A sell signal may be generated with a decline beneath the lower Diagonal trendline at 185.00.
(Barrons) The tide of fund flows has turned back in favor of high-yield bonds.
Investors pulled money from U.S. high-yield bond funds for the last 11 weeks of 2017, according to EPFR. This year started off on a brighter note, with January inflows of more than $1 billion. Why the change of heart?
High-yield bonds wobbled late last year as the stock market rallied, which is generally accepted as a sign that a big correction is imminent.
UST hovers at the lows.
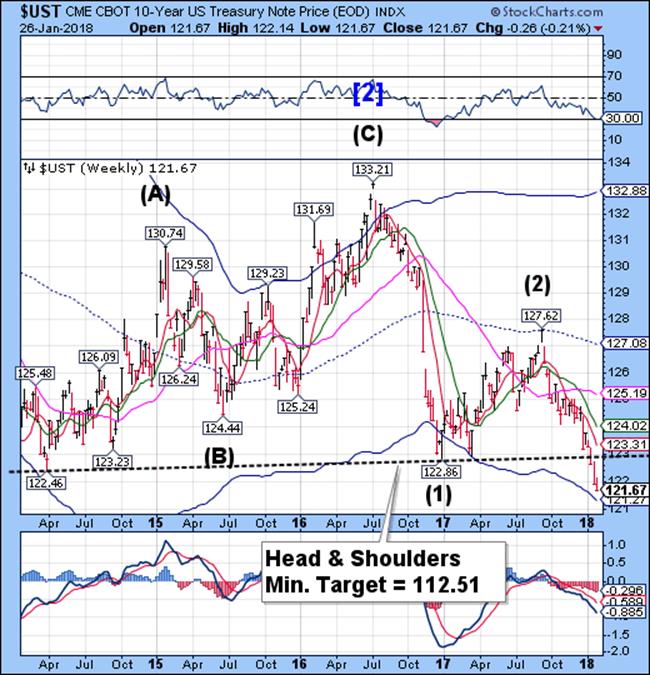
The 10-year Treasury Note Index revisited Monday’s low but no further, leaving the possibility open of a deeper decline. A Master Cycle low is due in the next week which may involve a probe of the Cycle Bottom support at 121.27. If so, the bounce may have its maximum resistance at the neckline.
(CNBC) U.S. government debt yields rose Friday after gross domestic product (GDP) data missed expectations.
The yield on the benchmark was higher at around 2.662 percent at 11:27 a.m. ET, while the yield on the 30-year Treasury bond was higher at 2.913 perc10-year Treasury noteent. Bond yields move inversely to prices.
Economic growth slowed in the last quarter as a swell in consumer spending resulted in an uptick in importing, the Commerce Department said Friday.
The Euro hits a critical Fibonacci relationship.
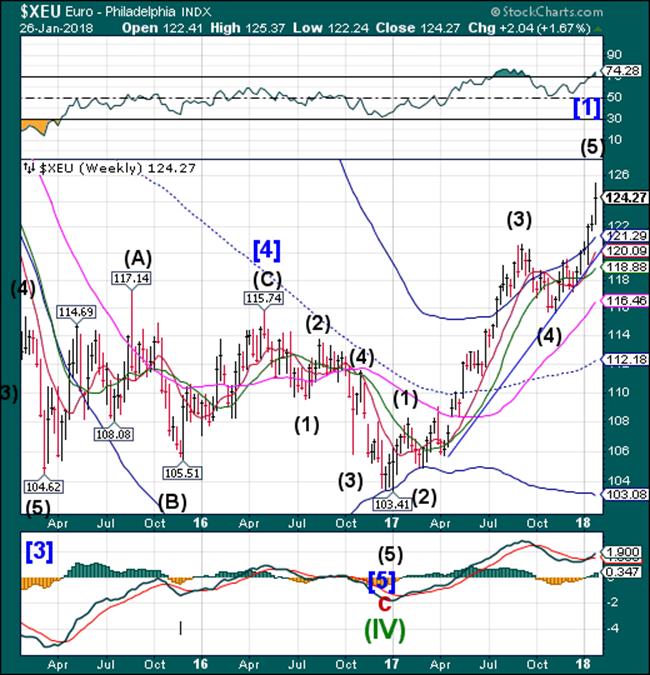
The Euro hit a critical Fibonacci turning point at 125.54 on Thursday, then turned down on Friday. That may complete the rally, or nearly so. The Euro has a double pivot due at the end of next week that I had originally interpreted as bullish. That may no longer be so. Be alert. A decline beneath the Cycle Top at 121.29 suggests the rally may be over. A sell signal lies at Intermediate-term support at 120.09.
(Reuters) - The dollar remained weak against a basket of currencies on Friday, bruised by comments by senior U.S. officials this week backing a weak dollar, and was on pace for its worst weekly fall since June.
The dollar index .DXY, which measures the greenback against a basket of six major currencies, was down 0.33 percent at 89.1 and on track for a weekly fall of 1.6 percent.
President Donald Trump’s comments on Thursday that he wanted a “strong dollar,” a day after Treasury Secretary Steven Mnuchin said a weaker greenback would help U.S. trade balances in the short term, failed to put a lid on volatility and keep dollar bears in check.
EuroStoxx losing momentum.
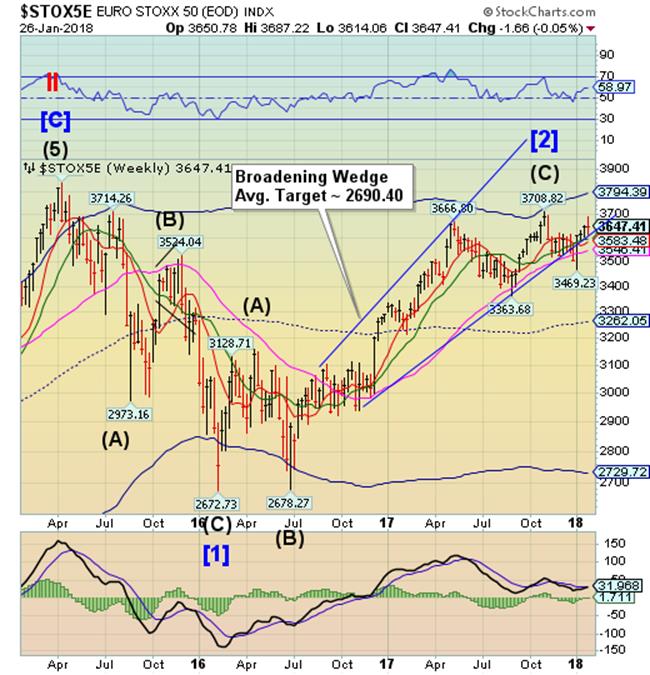
The EuroStoxx 50 Index peaked on Wednesday after a 90% retracement of its decline at the end of 2017. A break of the trendline an Intermediate-term support at 3595.95 may result in a sell signal.
(CNBC) European stocks closed higher on the last trading day of the week, as investors digested new earnings reports.
The pan-European STOXX 600 closed provisionally almost half a percent higher on Friday, with almost all sectors moving into the black. European bourses were higher, with France's CAC 40 outperforming fellow indexes on the back of strong earnings.
The Yen rockets above resistance.
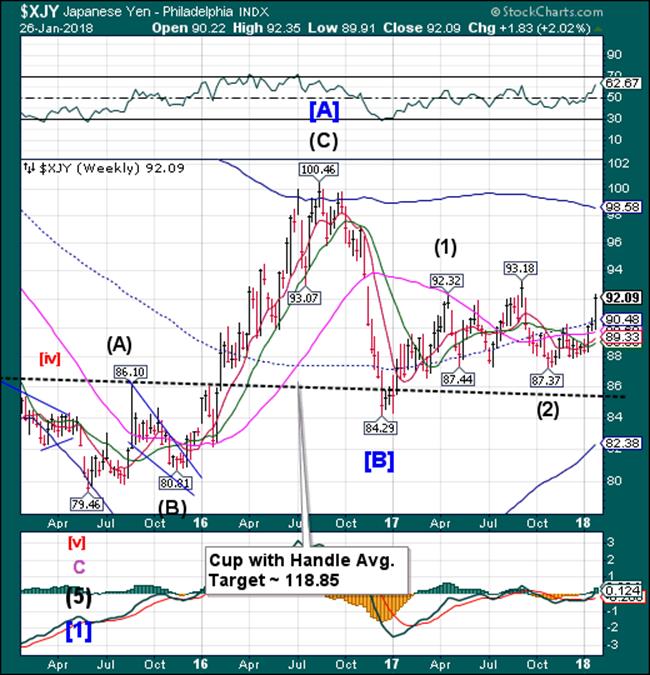
The Yen broke above mid-Cycle resistance at 90.48 on its way to Cycle Top resistance as the BOJ is speculated to scale back on QE. The Cycles Model suggests another surge of strength into early February, possibly longer.
The FinancialTimes has some insight on the state of the Yen.
(NHKWorld) The yen has surged after Bank of Japan Governor Haruhiko Kuroda said consumer prices are finally approaching the 2 percent target set by financial policymakers.
Kuroda made the comment in a World Economic Forum session at the Swiss resort of Davos on Friday.
The BOJ chief said the Japanese economy is recovering moderately, but improvements in prices and wages are weaker than in the US and Europe.
Kuroda said years of deflation have created a negative mindset among Japanese people, who don't expect prices and wages to rise.
Nikkei reverses.
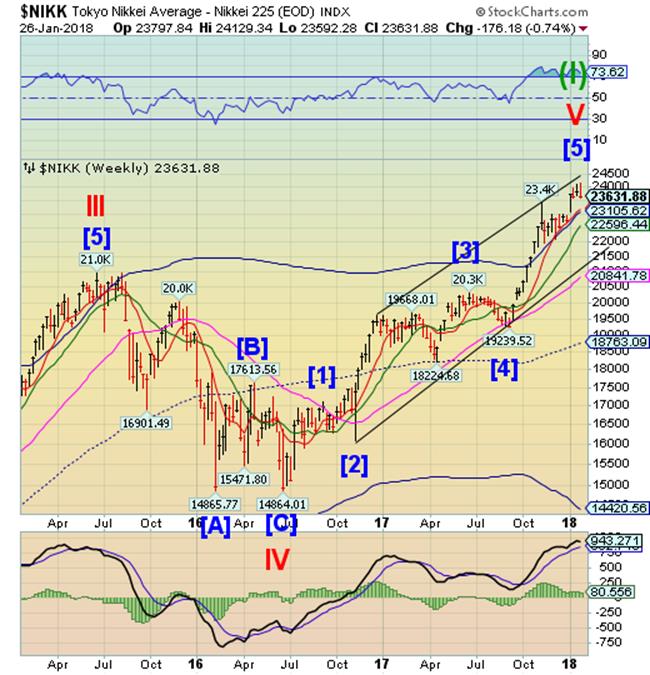
The Nikkei peaked on Tuesday, then close the week at a loss, making a potential key reversal week. A break beneath the Cycle Top at 23105.62 and Short-term support suggests the rally may be over, producing an aggressive sell signal. Confirmation comes at the crossing of the lower Diagonal trendline near 21500.00.
(Reuters) - Japan’s Nikkei share average ended lower in choppy trade on Friday as investors locked in profits ahead of the weekend, while mining shares and financial firms underperformed the market.
The Nikkei closed 0.2 percent down at 23,631.88, after oscillating in and out of positive terrain in early trade. For the week, the Nikkei declined 0.7 percent.
U.S. Dollar nearly reaches its target.
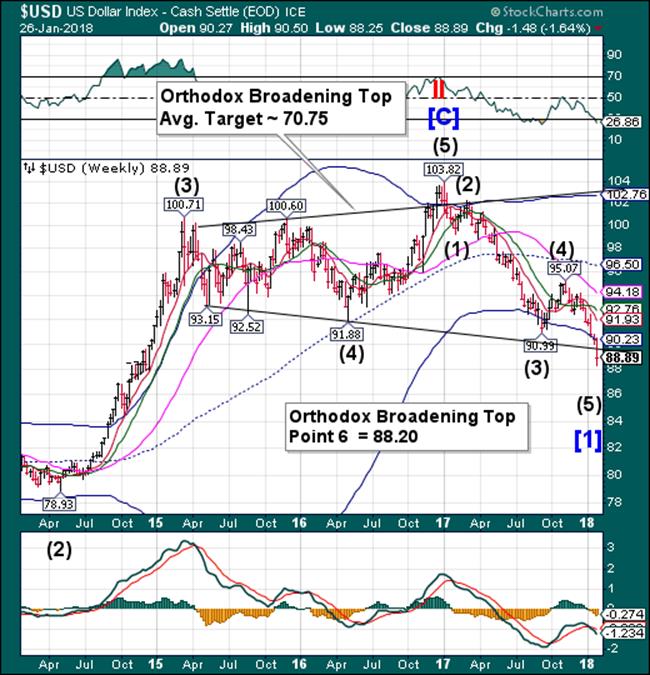
USD declined further, nearly reaching its “Point 6” target at 88.20. The fact is, the Cycles Model calls for a probable continuation of the decline to the week of February 5 with a likely overshoot of its goal. Having said that, reaching the target may be reason enough to take downside profits. As Sir John Templeton once said, “I like to leave a little on the table for the next guy.”
(CNBC) The greenback slid further Thursday after the Trump administration was seen as stepping back from the strong dollar policy that has been in place since the 1990s.
The dollar index was slightly lower, after falling sharply Wednesday on the initial comments from Treasury Secretary Steven Mnuchin that a weak dollar was good for U.S. trade. But when given the opportunity to clarify his comments at the World Economic Forum early Thursday, Mnuchin did not latch on to the strong U.S. dollar rhetoric used by past Treasury secretaries.
.Gold completes a Broadening Wedge.
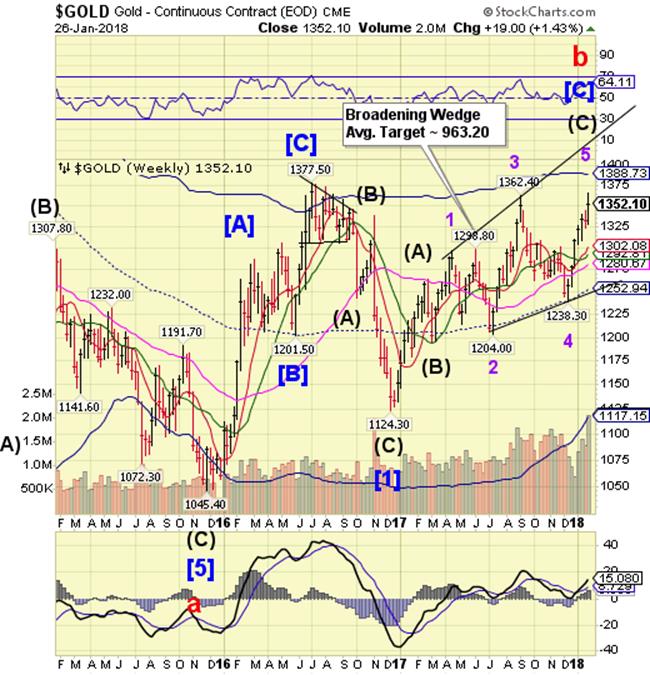
Gold made a new retracement high at 1365.40 this week, completing what appears to be the final leg of a Broadening Wedge. The final profile of this formation only became clear in the past week or two as this peak was not expected to exceed the September 2017 high. In addition, this is another Master Cycle inversion, suggesting the end of a trend,
(Reuters) - Gold rose on Friday, climbing back toward the previous day's 17-month peak as a
report of slow economic growth pushed the U.S. dollar lower, days after the greenback was hammered by a senior U.S. official backing a weaker currency.
The dollar was on track for its biggest weekly decline since May. President Donald Trump's comments on Thursday that he wanted a "strong dollar" failed to lend much support, a day
after Treasury Secretary Steven Mnuchin said a weaker greenback would help short-term U.S. trade balances.
Spot gold was up 0.3 percent at $1,351.86 by 1:37 p.m. EST (1837 GMT), up 1.5 percent this week. On Thursday, bullion hit $1,366.07, its highest since August 2016.
Crude probes to resistance.
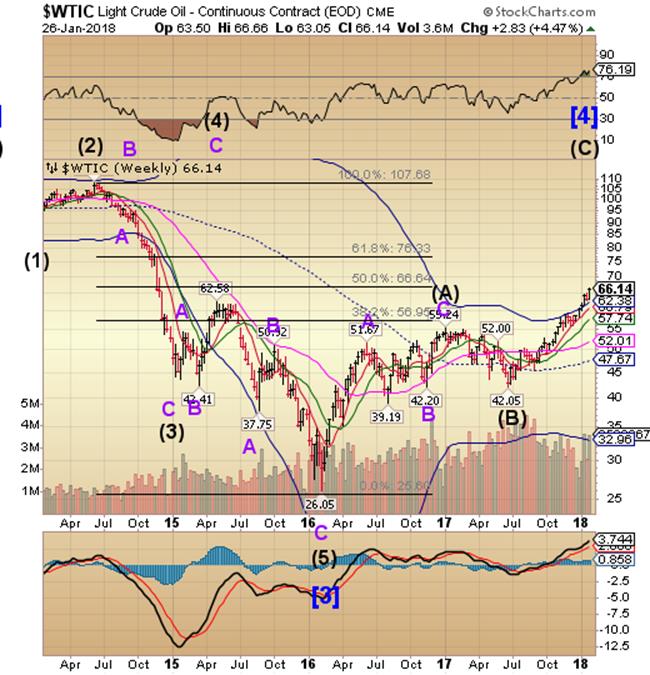
Crude probed to its Fibonacci 50% resistance at 66.64, then reversed into the end of the week. The rally may be considered over beneath its Cycle Top at 62.38. The fly in the ointment mentioned last week turned out to be a Master Cycle Inversion, suggesting the probable end of this uptrend. A decline beneath the Short-term support at 60.79 gives a probable sell signal.
(CNBC) Oil prices could tumble as much as $8 a barrel in the coming weeks as one of the three legs propping up an unexpected rally looks "wobbly," Societe Generale's Mark Keenan warned on Friday.
The rally in oil prices has exceeded many analysts' expectations, leading to a flurry of revised forecasts as benchmark crude futures surged by about $10 a barrel in the last six weeks to their highest levels since early December 2014.
Shanghai Index challenges its Cycle Top.
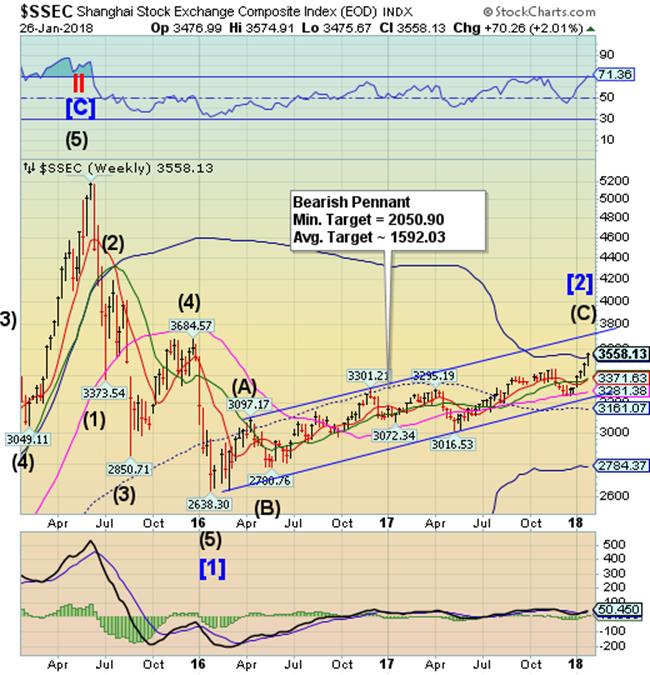
The Shanghai Index is challenging its Cycle Top resistance at 3537.78. The expected period of strength extended to the end of the week. The potential for a sharp sell-off rises as the Shanghai Index reversed beneath Cycle Top support. Analysts are now bullish on the Shanghai Index, as you can see below.
(CNBC) China's stock market is on a remarkable winning streak, and one analyst sees its rapid run stretching even further.
"The growth will continue and the growth will continue at a rapid pace," Michael Bapis, managing director of The Bapis Group at HighTower Advisors, told CNBC's "Trading Nation" on Wednesday. "The expansion that's happening there is rapid, once in a lifetime and we think it's going to continue."
The Banking Index rallies upon its Cycle Top.
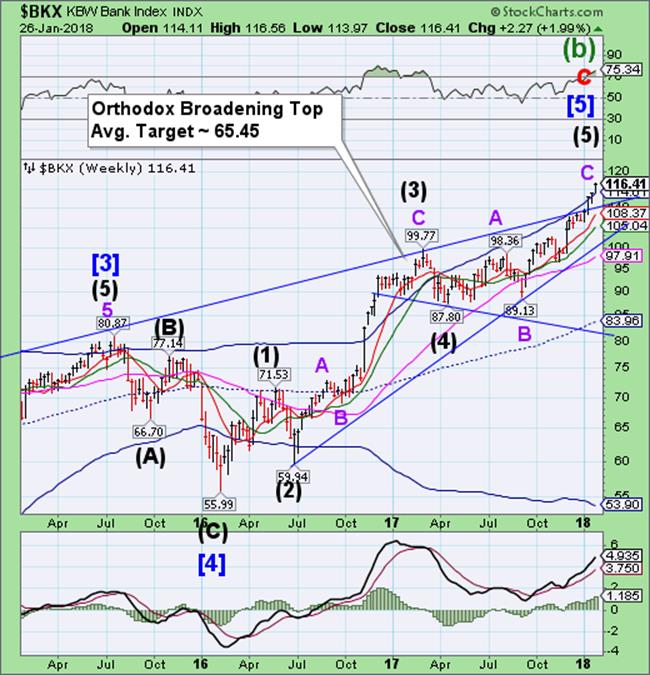
-- BKX threw over its Cycle Top resistance at 114.01 as it appears to complete an Ending Diagonal formation. Important Fibonacci relationships have been fulfilled. A decline beneath the Ending Diagonal trendline at 102.00 suggests a potential sell signal. If the Orthodox Broadening Top formation is correctly identified the next move may be beneath the trendline near 80.00.
(Reuters) - Bank of England Governor Mark Carney said on Friday that markets are likely to be affected when central banks around the world raise interest rates, but that reforms to the financial system meant there would be limited impact on the real economy.
“What’s the probability that there will be an adjustment in asset prices? Yup, that probability has gone up,” Carney said when asked about the chance of sharp falls in asset prices during a World Economic Forum panel discussion.
“The question is whether the core of the financial system is in a position where it’s going to amplify those movements in an adverse way and there will be a feedback to the real economy,” Carney said. “And on that component of the probability, I would put that as quite low.”
(Investopedia) It's been quite a financial turnaround. Less than a decade ago, many big U.S. banks were on the verge of collapse during the financial crisis. Today, the banking sector appears to be in robust health. Indeed, respected bank analyst Dick Bove of the Vertical Group goes so far as to assert that banks are entering an unprecedented period of growth, what he calls "a true 'Nirvana' here on earth," in a commentary for CNBC. He rests his optimism on four factors: tax reform, a shift in monetary policy, regulatory reform, and technological advances.
(ZeroHedge) $11,589.01.
That’s the US dollar amount of American stocks the Swiss National Bank owns on behalf of every man, woman and child in Switzerland. Let that sink in.
. A Central Bank has taken on itself to expand its balance sheet and invest in the proceeds, not in gold, nor sovereign debt - heck not even in corporate bonds. Nope, the SNB has taken it upon itself to “invest” that money in another country’s most risky part of the capital structure - equity.
And don’t think it’s a small number. It’s almost $100 billion US dollars.
Regards,
Tony
Our Investment Advisor Registration is on the Web.
We are in the process of updating our website at www.thepracticalinvestor.com to have more information on our services. Log on and click on Advisor Registration to get more details.
If you are a client or wish to become one, please make an appointment to discuss our investment strategies by calling Connie or Tony at (517) 699-1554, ext 10 or 11. Or e-mail us at tpi@thepracticalinve4stor.com .
Anthony M. Cherniawski, President and CIO http://www.thepracticalinvestor.com
As a State Registered Investment Advisor, The Practical Investor (TPI) manages private client investment portfolios using a proprietary investment strategy created by Chief Investment Officer Tony Cherniawski. Throughout 2000-01, when many investors felt the pain of double digit market losses, TPI successfully navigated the choppy investment waters, creating a profit for our private investment clients. With a focus on preserving assets and capitalizing on opportunities, TPI clients benefited greatly from the TPI strategies, allowing them to stay on track with their life goals.
Disclaimer: The content in this article is written for educational and informational purposes only. There is no offer or recommendation to buy or sell any security and no information contained here should be interpreted or construed as investment advice. Do you own due diligence as the information in this article is the opinion of Anthony M. Cherniawski and subject to change without notice.
Anthony M. Cherniawski Archive |
© 2005-2022 http://www.MarketOracle.co.uk - The Market Oracle is a FREE Daily Financial Markets Analysis & Forecasting online publication.


