


Have You Seen Palladium’s Tradable Price Pattern?
Commodities / Palladium Jan 25, 2018 - 12:36 PM GMTBy: Chris_Vermeulen

 Are you prepared for the next big move in the metals markets? Would you like to know what to expect in the immediate future that could save you thousands of dollars? Then pay attention to this message as we share something most traders are overlooking right now.
Our research team at Technical Traders Ltd. have spent years developing our skills and financial modeling systems. Right now, many traders are seeing the big upward price swings in the metals as a sign that prices will continue higher. Well, in the long run, they are correct. But right now we believe the metals will roll over and trend lower for the next few weeks setting up for the next leg higher.
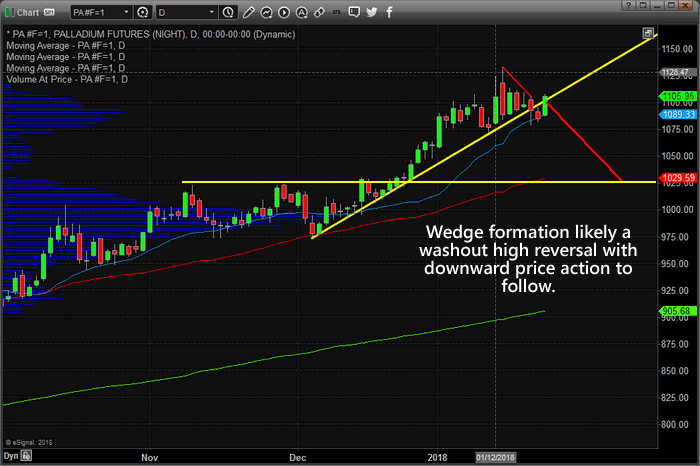
Palladium is a perfect example of this Rollover expectation. Both the current long-term monthly chart shows signs of a massive double top, and the daily chart WEDGE/Pennant formation is likely a washout high rotation pattern that will prompt lower prices over the next few days/weeks.
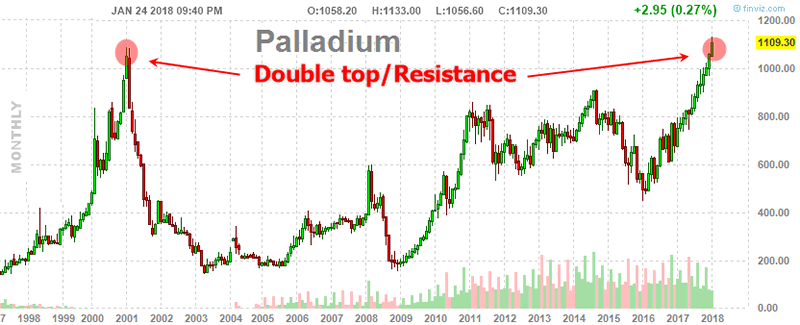
Monthly Palladium Chart
This monthly chart to us is nothing more than a reason for the overbought Palladium market to have a minor pullback before potentially running to new highs. We could see a couple weeks or potentially a few months of weaker prices, but the point here is that price is overbought and at resistance on the long-term chart and imminent pullback is likely to occur for a tradable short or to re-enter after the price has corrected and shows signs of strength for another run higher.
Daily Palladium Chart
As you can see from this chart, we are expecting a rotation lower based on our modeling systems predictive capabilities that will result in a substantially lower price swing – possibly as much as -8 to -10%. We believe support will be found just above the $1000 price level.
Additionally, our Adaptive Dynamic Learning (ADL) modeling system is designed to scan historical price activity of any chart and find the unique price and technical indicator formations that operate as DNA markers for the price. It then continues to scan for new or repeating DNA markers in the market to determine probable outcomes of the price going forward. In this case, the ADL system is predicting a lower price swing to near $1020 near or after February 8th. After this price contraction, the ADL system is expecting a solid rally to form.
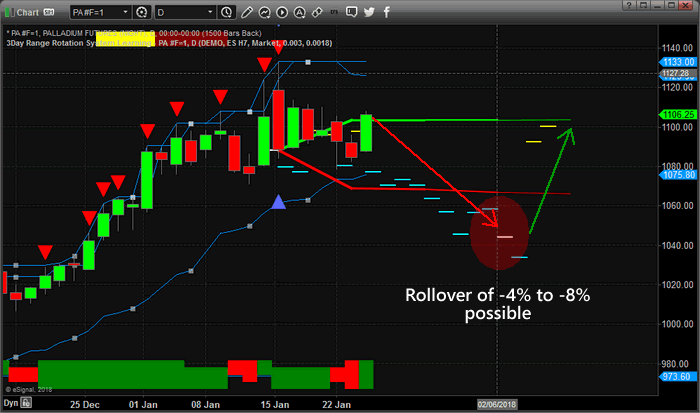
This should be important to all investors because long traders in the metals should wait for this pullback to happen before getting into heavy positions. Our analysis shows we should see a -4 to -8% price pullback within the next week or two before support will be found. Obviously, buying near the lowest point is the objective of trading and we believe the February 5th through February 8th timeframe should provide the optimal bottom rotation period for metals traders.
Would you like to receive daily video analysis of our research for all the major markets as well as continue to receive our advanced research reports? Want to know that the US majors Indexes are going to do tomorrow or next week? Take a minute to investigate www.TheTechnicalTraders.com to learn how we can assist you in your trading. Learn how we called this move in the US Indexes for 2018 and how we can continue to identify market moves before they happen with our proprietary modeling systems.
Chris Vermeulen
www.TheGoldAndOilGuy.com – Daily Market Forecast Video & ETFs
www.ActiveTradingPartners.com – Stock & 3x ETFs
Chris Vermeulen is Founder of the popular trading site TheGoldAndOilGuy.com. There he shares his highly successful, low-risk trading method. For 7 years Chris has been a leader in teaching others to skillfully trade in gold, oil, and silver in both bull and bear markets. Subscribers to his service depend on Chris' uniquely consistent investment opportunities that carry exceptionally low risk and high return.
Disclaimer: Nothing in this report should be construed as a solicitation to buy or sell any securities mentioned. Technical Traders Ltd., its owners and the author of this report are not registered broker-dealers or financial advisors. Before investing in any securities, you should consult with your financial advisor and a registered broker-dealer. Never make an investment based solely on what you read in an online or printed report, including this report, especially if the investment involves a small, thinly-traded company that isn’t well known. Technical Traders Ltd. and the author of this report has been paid by Cardiff Energy Corp. In addition, the author owns shares of Cardiff Energy Corp. and would also benefit from volume and price appreciation of its stock. The information provided here within should not be construed as a financial analysis but rather as an advertisement. The author’s views and opinions regarding the companies featured in reports are his own views and are based on information that he has researched independently and has received, which the author assumes to be reliable. Technical Traders Ltd. and the author of this report do not guarantee the accuracy, completeness, or usefulness of any content of this report, nor its fitness for any particular purpose. Lastly, the author does not guarantee that any of the companies mentioned in the reports will perform as expected, and any comparisons made to other companies may not be valid or come into effect.
Chris Vermeulen Archive |
© 2005-2022 http://www.MarketOracle.co.uk - The Market Oracle is a FREE Daily Financial Markets Analysis & Forecasting online publication.