


London Property Market Crash Looms As Prices Drop To 2 1/2 Year Low
Housing-Market / UK Housing Jan 15, 2018 - 01:31 PM GMTBy: GoldCore

 – London homeowners cut property prices by another 1.4% in January
– Average price for a London house dropped by £22,000 to £600,926 in 2017
– Takes 78 days to sell a home on average, the highest level since 2012
– London’s downtrend continues after 2017 performance as worst UK housing market
– UK regional house prices begin to falter as house prices climb slows down
– Gold bullion remains a great hedge for property investors
Editor: Mark O’Byrne
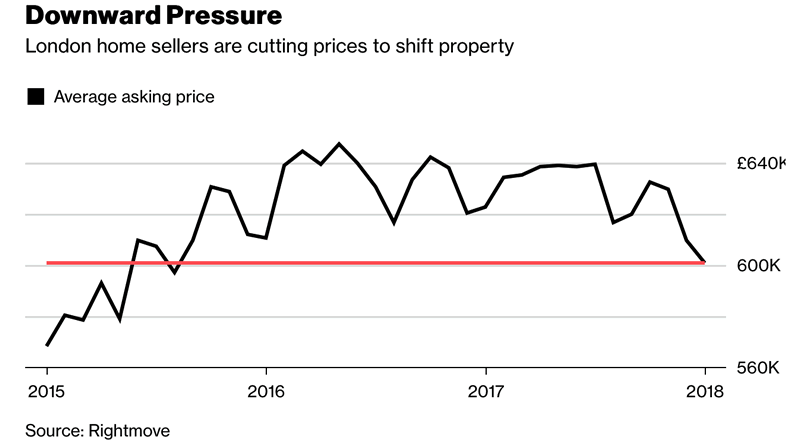
Source Rightmove via Bloomberg
The London property bubble slow motion bursting continues with the latest data from property website Rightmove showing house prices in London were down by another 1.4% in January.
There is little sign of the optimism that we usually see in the London property market at the start of January. This means the losing streak of 2017 has been carried over into the start of 2018. The possibility of a London property crash looms large.
In the past year London homes are now an average of £22,000 cheaper and have fallen to just over £600,000, a 3.5 per cent fall over the last year. However this does not reflect the damage being felt by London’s own ‘zones’ outside of zone 1. Sellers of homes in Zone 3 saw the biggest fall in prices, of 7.7%, while Zone 2 saw prices drop by 6.4%.
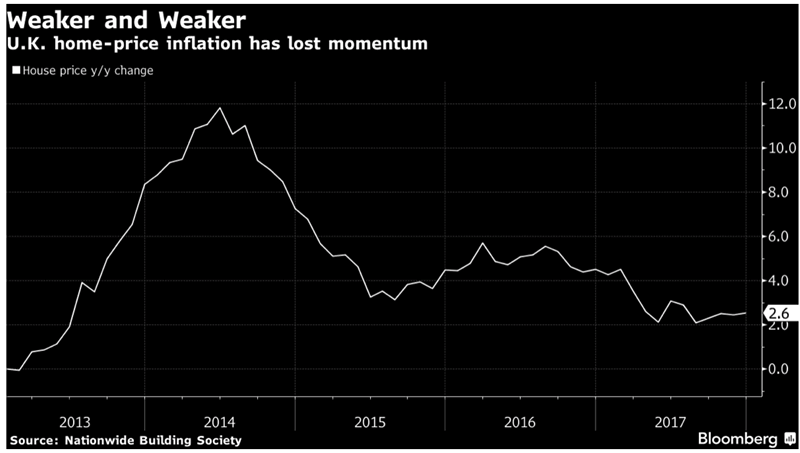
Nationwide via Bloomberg (December 2017)
It is also taking longer for homeowners to shift property. The average number of days has increased from 71 to 78 between December and January. This amount of time was last seen at the beginning of 2012.
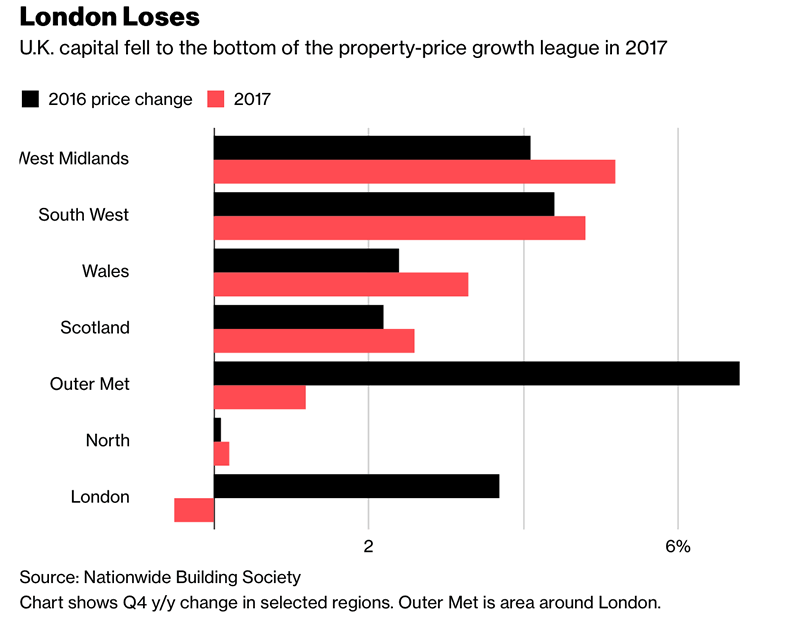
London no longer paved with gold
Last year the capital’s housing market was the worst in the UK. This month it is the same. In a weird reversal of fortunes regions outside of London are managing relatively well with increased interest rates and tighter wage conditions. Conversely, London is beginning to feel the pinch, likely as Brexit risks loom large.
However, it’s not exactly booming for UK regions either. Last month prices only climbed marginally and the annual growth rate fell for the seventh month to just 0.2 percent. This brings it to its lowest since March 2012.
2012 seems to be the point to which the market is returning to but 2009 looms large in the background. Ir is worth noting that from 2006 to 2016, average house prices in London grew from £257,000 to £474,000 or by a very substantial 84.4%.
London property owners have not been seen dropping house prices this much since 2009 – when the financial crisis really began to take hold.
Much of the fall in London’s house prices are a reflection of the gulley that has formed between property prices and the reality which so many Londoners are faced with. The majority of first-time buyers in the capital would have once aimed for first-homes in zones 1 and 2. Now, this is becoming increasingly out of reach.
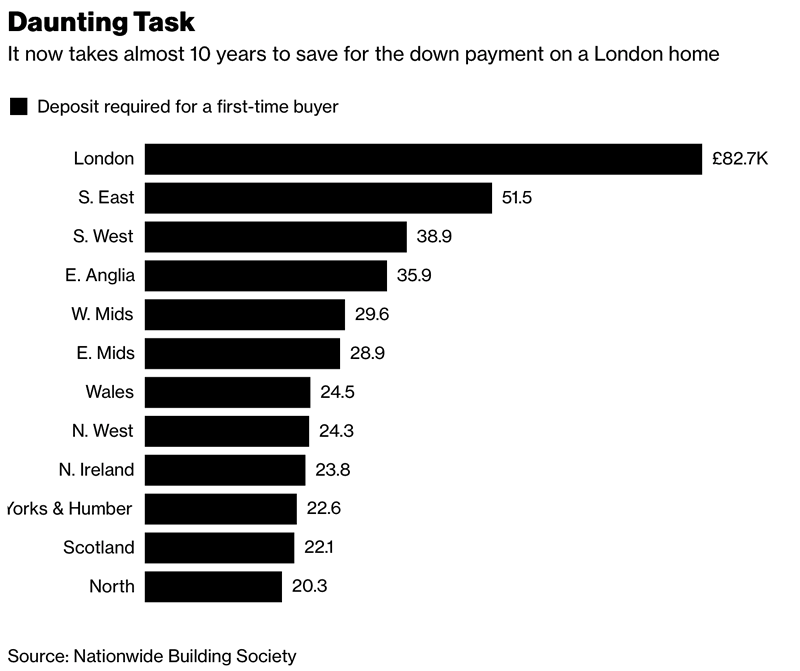
Whilst we are yet to see the impact of November’s rate rise, times are already tough for new buyers. Initial mortgage repayments for your standard London first-time property can account for more than 60% of average take-home pay, double the proportion elsewhere in Britain. This might not seem to big a leap for those who are covering similar amounts through rent payments but consider a 10% deposit can easily require more than a year’s salary in savings.
Nationwide considers a more dire situation. Given banks’ tougher lending conditions they believe it is better to look at 20% deposit, rather than a 10% one. They estimate it would take around 10 years for a first-time buyer in the capital to save up the amount. In the rest of the UK it would take eight years.
Real life now coming into play
Ten years prior to the massive 2006 – 2016 boom, average house prices in London in 1997 were below £85,000 so it took just two decades for prices to rise over 450%.
As often happens with rising markets an air has formed around London’s property market – both residential and commercial – that they are invincible and that they are a gold like safe haven.
But London (and no doubt soon the rest of the UK) are not infallible to the fallout from the financial crisis and the risks of Brexit.
Bank of England data released earlier this month showed that approvals for mortgages were little changed in November and below the six-month average.
There are also the factors of a pretty tough inflation squeeze and tax changes which affect both landlords and owners of second homes, to be taken into account. The deposit data alone shows that the UK property markets is descending into an affordability crisis.
Those hoping this is just a blip in the boom are mistaken. House prices are already high, mortgage rate approval is relatively low and rates cannot go any lower. These combined with the economic hurt so many are facing (and will continue to face) do not make a recovery look very likely.
Own physical gold to hedge falls in physical property
It is difficult to effectively hedge property investments but given gold’s relationship with increasingly correlated interest rates and economic cycles, it is again likely to act as a good hedge in a downturn or indeed in a full blown London property crash.
A downturn or total collapse of the property market would not just affect homeowners and mortgage providers. It would send major waves through the rest of the economy. If the property market corrects sharply or crashes, companies, councils and irresponsible lenders will need to be bailed out. Bail out money doesn’t grow on trees, it comes (one way or another) from ordinary people like you and I.
Therefore, exposure to a potential property crisis does not just come about if you own or rent a property. All investors, savers and consumers are exposed, as we all have dependencies on the UK banking, financial and economic systems. All of which would be vulnerable in a property crash.
It is the debt-fueled banking system that has been keeping this jig up for the last few decades. Along with the government they are responsible for making homeownership look like the ultimate ‘I have arrived’ purchase. To make the situation of being an individual with hundreds of thousands in debt a desirable one is one of the biggest confidence trick of all time.
So far the swindle has worked out on behalf of those who have fallen for it. They have seen property prices rise whilst interest rates remain at record lows.
But there are increasing jitters about the London property confidence trick. A London property crash seems quite likely given the clear overvaluation and many risks. At the very least we expect a very sharp correction indeed.
The good news is that this will not happen overnight. Prudent investors looking to get their affairs in order have time to diversify and decide on a reasonable allocation to gold bullion. They should do so and opt to own physical gold coins and bars held in allocated and segregated storage in safer, less debt laden jurisdictions.
Gold Prices (LBMA AM)
15 Jan: USD 1,343.00, GBP 971.93 & EUR 1,092.93 per ounce
12 Jan: USD 1,332.90, GBP 978.75 & EUR 1,099.78 per ounce
11 Jan: USD 1,319.85, GBP 978.14 & EUR 1,104.45 per ounce
10 Jan: USD 1,321.65, GBP 976.96 & EUR 1,103.31 per ounce
08 Jan: USD 1,314.95, GBP 972.01 & EUR 1,102.19 per ounce
08 Jan: USD 1,318.80, GBP 974.33 & EUR 1,099.09 per ounce
05 Jan: USD 1,317.90, GBP 973.40 & EUR 1,094.25 per ounce
Silver Prices (LBMA)
15 Jan: USD 17.12, GBP 12.58 & EUR 14.14 per ounce
12 Jan: USD 17.12, GBP 12.56 & EUR 14.12 per ounce
11 Jan: USD 17.01, GBP 12.64 & EUR 14.24 per ounce
10 Jan: USD 17.13, GBP 12.64 & EUR 14.27 per ounce
09 Jan: USD 17.05, GBP 12.60 & EUR 14.30 per ounce
08 Jan: USD 17.17, GBP 12.68 & EUR 14.33 per ounce
05 Jan: USD 17.15, GBP 12.66 & EUR 14.24 per ounce
Please share our research with family, friends and colleagues who you think would benefit from being informed by it.
Mark O'Byrne
This update can be found on the GoldCore blog here.
IRL |
UK |
IRL +353 (0)1 632 5010 |
WINNERS MoneyMate and Investor Magazine Financial Analysts 2006
Disclaimer: The information in this document has been obtained from sources, which we believe to be reliable. We cannot guarantee its accuracy or completeness. It does not constitute a solicitation for the purchase or sale of any investment. Any person acting on the information containd in this document does so at their own risk. Recommendations in this document may not be suitable for all investors. Individual circumstances should be considered before a decision to invest is taken. Investors should note the following: Past experience is not necessarily a guide to future performance. The value of investments may fall or rise against investors' interests. Income levels from investments may fluctuate. Changes in exchange rates may have an adverse effect on the value of, or income from, investments denominated in foreign currencies. GoldCore Limited, trading as GoldCore is a Multi-Agency Intermediary regulated by the Irish Financial Regulator.
GoldCore is committed to complying with the requirements of the Data Protection Act. This means that in the provision of our services, appropriate personal information is processed and kept securely. It also means that we will never sell your details to a third party. The information you provide will remain confidential and may be used for the provision of related services. Such information may be disclosed in confidence to agents or service providers, regulatory bodies and group companies. You have the right to ask for a copy of certain information held by us in our records in return for payment of a small fee. You also have the right to require us to correct any inaccuracies in your information. The details you are being asked to supply may be used to provide you with information about other products and services either from GoldCore or other group companies or to provide services which any member of the group has arranged for you with a third party. If you do not wish to receive such contact, please write to the Marketing Manager GoldCore, 63 Fitzwilliam Square, Dublin 2 marking the envelope 'data protection'
GoldCore Archive |
© 2005-2022 http://www.MarketOracle.co.uk - The Market Oracle is a FREE Daily Financial Markets Analysis & Forecasting online publication.