


US Dollar Could See Further Declines in Forex Markets
Currencies / US Dollar Jan 11, 2018 - 07:13 AM GMTBy: Submissions

The US Dollar has had a tumultuous period over the last year, as optimism and pessimism have vied for broader control in the foreign exchange markets. Rallies in the stock market have emerged as the major victor, however, as investors seem to be reading the pro-growth agenda put forward by the Trump administration as a better precursor for improvements in corporate earnings (rather than in the US Dollar itself).
The best way of measuring these trends is generally through the US Dollar Index (DXY) as it relates the US Dollar value toa number of different currencies within the basket, and this is a good indicator of the general momentum that is likely to be found in these parts of the market.
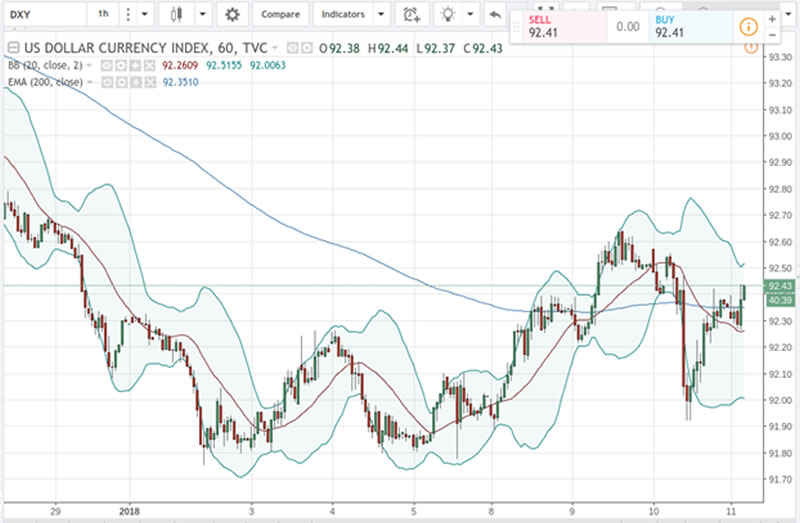
In this chart, the new forex trends that we are seeing have been characterized by a chart rebound in the USD from the lows that were posted during the earlier parts of this month. Increased volatility was seen after the most recent release of the US Non Farm Payrolls figures, but markets have since returned to pre-release levels once the dust managed to settle.
Events like these can be traded using the modified double stochastic trading strategy given the extent of the prior moves, and the scope for longer-term follow through that could be seen once the broader market trend starts to reassert itself. In the current scenario, the most likely outcome is that we see a break of the double-bottom lows that were posted in the earlier parts of this month.
Confirmation of this outlook will be seen if there are new failures at the 92.60 level, as this is likely to contain markets over the next several weeks. Moving average readings are also supportive, given the fact that the 20-period EMA on the daily charts is once again moving below the highly critical 200-period EMA on the same price history.
Currently, markets are holding within the 2-standard deviation Bollinger Band and this suggests that shorter-term traders can position on both sides of the market with tight stop losses. Longer-term, however, the picture is much more one-side as it suggests that we will continue to see forex selling pressure in DXY.
Copyright © 2018 New Forex Trends - All Rights Reserved Disclaimer: The above is a matter of opinion provided for general information purposes only and is not intended as investment advice. Information and analysis above are derived from sources and utilising methods believed to be reliable, but we cannot accept responsibility for any losses you may incur as a result of this analysis. Individuals should consult with their personal financial advisors.
© 2005-2022 http://www.MarketOracle.co.uk - The Market Oracle is a FREE Daily Financial Markets Analysis & Forecasting online publication.