


A Timely Lesson for Today’s Stock Market Investors
Stock-Markets / Stock Markets 2018 Jan 06, 2018 - 07:17 AM GMTBy: EWI

 "The names may change, but the psychology remains the same."
Have you ever compared chart patterns from history with financial markets today? Elliott Wave International can show you the unique value of doing exactly that.
Why?
Because patterns on market charts repeat themselves. It happens across the globe, regardless of time period. When a still-unfolding pattern in the present looks a lot like a chart from the past, the price action to come may well remain on that earlier path.
Which means you can anticipate what's next. [Ed. note: this video link shows you an example]
As the book The Mania Chronicles (2009) by Peter Kendall and Robert Prechter says:
The names may change, but the psychology remains the same.
The Mania Chronicles is an account of the financial bubble between 1995 and 2008, and it illustrates the point with this September 2000 chart and commentary:
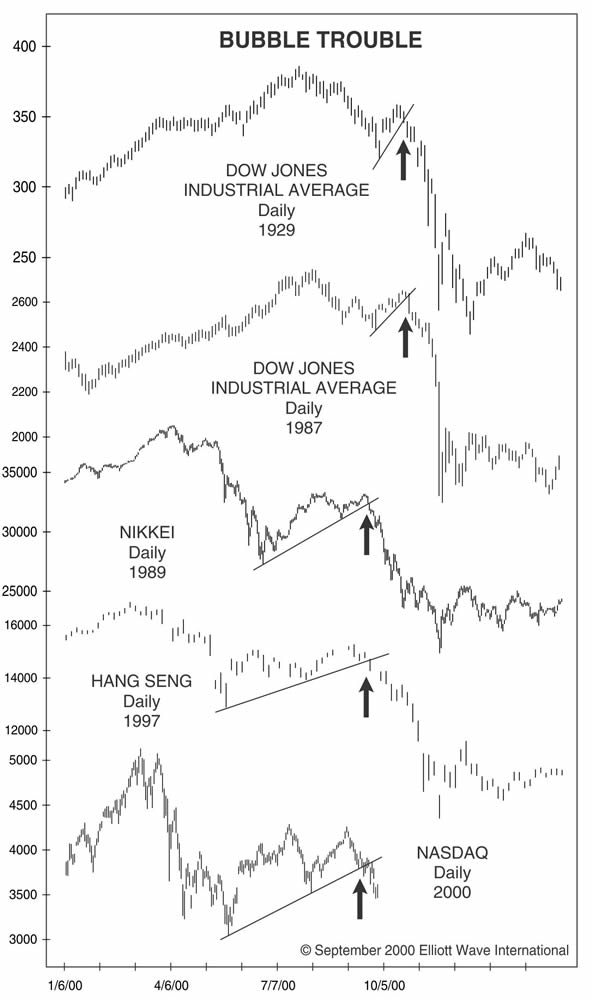
Since January [2000], the Elliott Wave Financial Forecast has been tracking the NASDAQ's uncanny resemblance to the Japanese Nikkei-225 in 1989 and 1990. Now that it has fallen and bounced, it has acquired a look that is also very similar to the post-peak performance of the 1929 DJIA, the 1987 DJIA and the 1997 Hong Kong Hang Seng index.
In all cases, the manic final run to all-time highs was followed by an initial leg down that led to a three-wave countertrend rebound, the classic Elliott wave signature of a correction. Look closely, and you will notice that these rebounds usually start with a big up day (sometimes on a gap) that fools the bulls into thinking that a major bottom has been recorded. The rallies last mere days, though, and then prices turn down in a crash. The NASDAQ gapped higher off its May low at 3043 and then traced a three-wave move to the September 1 high of 4260. The decline since then has violated the trendline support that contained the entire countertrend rally.
…The clock is ticking for the start of the "cascading phase" of the pattern. Prices may rally briefly, but a severe decline is likely.
As we now know, the NASDAQ did cascade downward into 2002, with the entire 2000-2002 bear market consuming 78% of the index's value.
Lately, Elliott Wave International has also been reviewing other chart formations with similarities to the present.
In July 2017, the Elliott Wave Financial Forecast showed this chart and said:
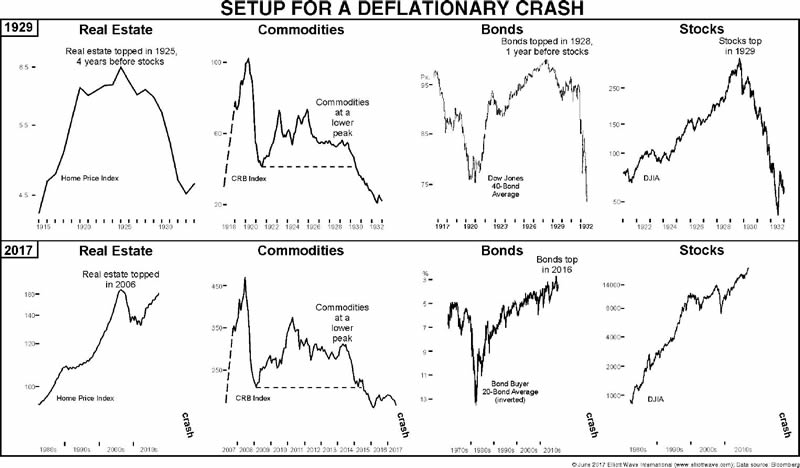
The chart shows [a] succession of tops. The bottom four panels show peaks in real estate, commodities and bonds since 2006, and an impending high in stocks. The topping sequence is similar to that which occurred during the last peak of Supercycle degree, wave (III) in 1929. The current top is a Grand Supercycle degree peak ….
Since we showed that chart in July 2017, yet another chart pattern surfaced in the stock market -- and it's eerily similar to 1929. EWI's Robert Folsom reveals that pattern, in his Chart of the Day video titled "Believe Your Own Eyes: Ghost of a Stock Market Past in the Present." Follow this link to watch the video.
This article was syndicated by Elliott Wave International and was originally published . EWI is the world's largest market forecasting firm. Its staff of full-time analysts led by Chartered Market Technician Robert Prechter provides 24-hour-a-day market analysis to institutional and private investors around the world.
© 2005-2022 http://www.MarketOracle.co.uk - The Market Oracle is a FREE Daily Financial Markets Analysis & Forecasting online publication.