


The 10 Key Charts For Global Multi-Asset Investors In 2018
Stock-Markets / Financial Markets 2018 Jan 05, 2018 - 03:21 PM GMTBy: Submissions

 Callum Thomas writes: As interesting and sometimes even amusing as it is to look back in time and reflect, as investors we get paid for looking forward and anticipating what may come. In this respect there’s a few existing trends and themes that will remain front of mind for me this year and will be key to keep on your radar in understanding the risks and opportunities in 2018.
Following is a selection of the key charts and indicators, the themes span inflation, monetary policy, commodities, China, emerging markets, corporate bonds, global equities, volatility, and bond yields. In other words, all the issues and topics that most active asset allocators should be thinking about. I'll be covering these topics in more detail in the coming weeks.
I've said it before and I'll say it again: 2018 is going to be harder and more complex for investors than 2017. The cross currents of rising valuations across asset classes and markets, maturing of the business cycle at a global level, and the turning of the tides in monetary policy could make 2018 a watershed year.
That all said, here's the charts! Best wishes and best of luck for 2018.
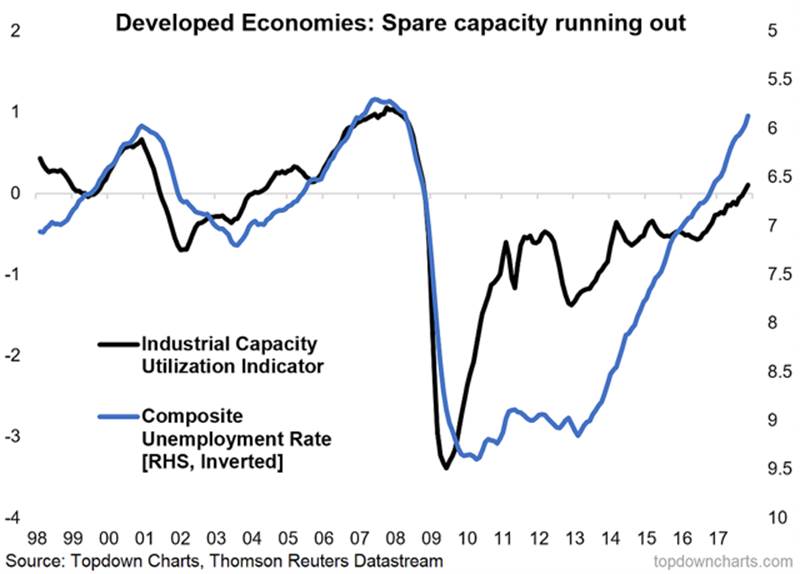
1. Much better cyclical economic prospects across developed economies has seen measures of industrial capacity and labor market tightness return to pre-crisis levels. This is probably the best leading indicator of a rise in inflationary pressures and reflects a maturing global business cycle.
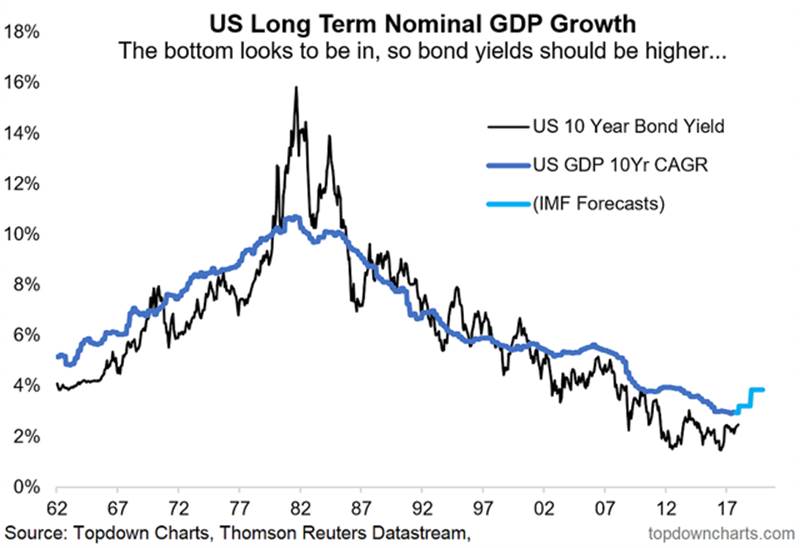
2. A secular bottom in 10-year bond yields looks to be on the cards, which will be reinforced by a projected bottoming out of long term GDP growth metrics.
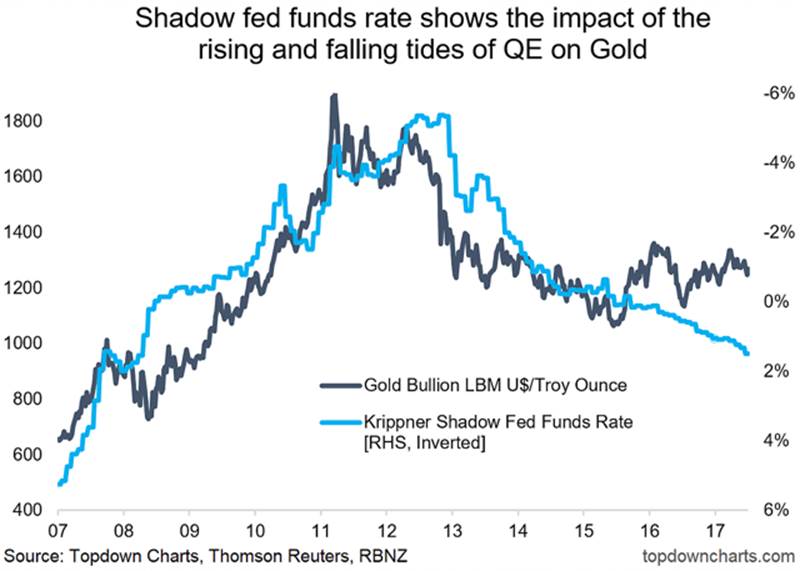
3. The monetary tides are going out as the Fed progressively moves into quantitative tightening and hikes rates. You can see this in the shadow (QE-adjusted) fed funds rate, and the historical relationship suggests caution for gold and this is just one example of the impacts of QE to QT.
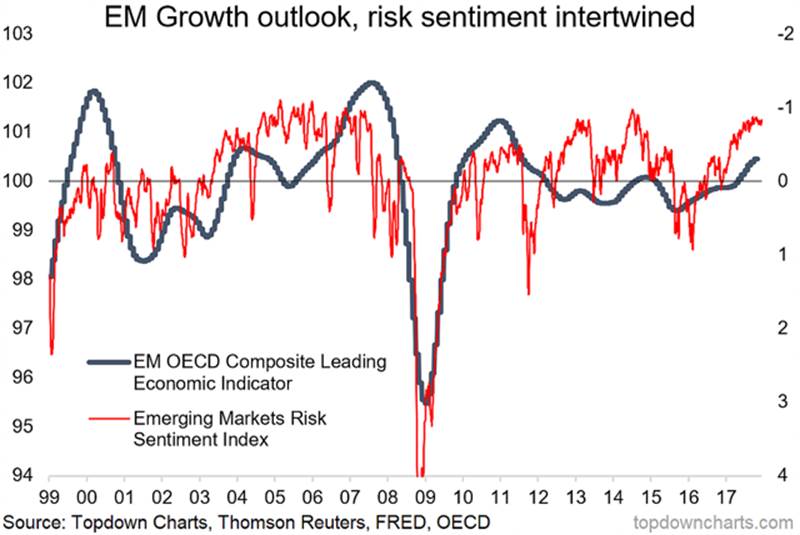
4. Emerging Markets cross-asset risk pricing is complacent/confident, and for now is engaged in a virtuous cycle as improving economics reinforce the relaxed risk perceptions.
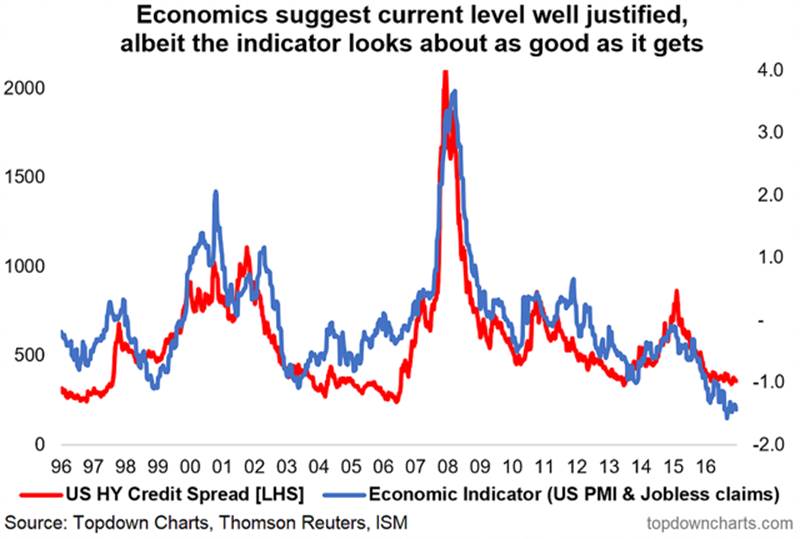
5. Likewise, US HY credit spreads are anchored by solid macroeconomic cycle dynamics… in other words, “expensive” can stay expensive for the time being.
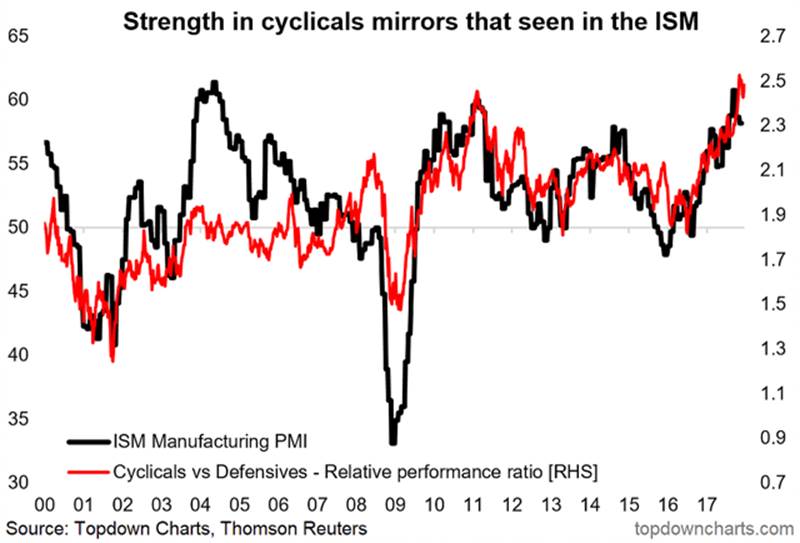
6. US cyclical stocks are closely keeping pace with the very strong ISM manufacturing PMI but the relative performance ratio looks very stretched, likewise absolute and relative valuations. This is a key area to keep on top of as the new bull market in America (and globally) has been driven by solid outperformance by the cyclical stock sectors.
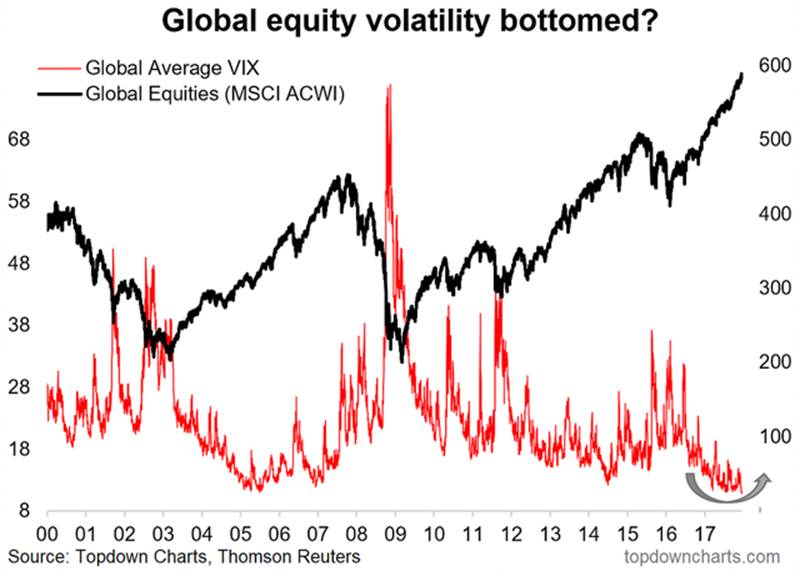
7. An open question for 2018: will the second great moderation continue? Or will global equity volatility reach a turning point?
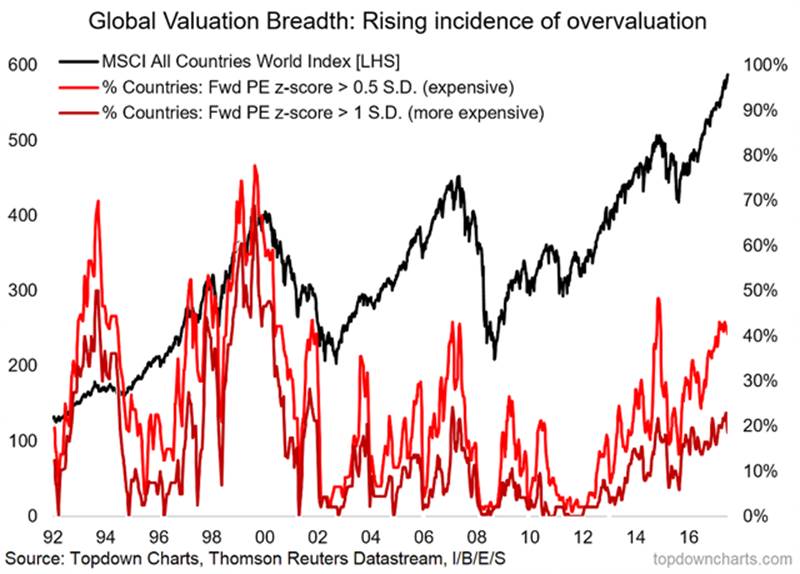
8. One issue (alongside the themes of a maturing business cycle and a turning of the tides in global monetary policy) is a rising incidence of overvaluation across markets (and assets). It’s not at previous extremes yet, and valuation is not by itself a reason for markets to fall, but it is an important fact to incorporate and reflects increasingly optimistic expectations on the growth outlook.
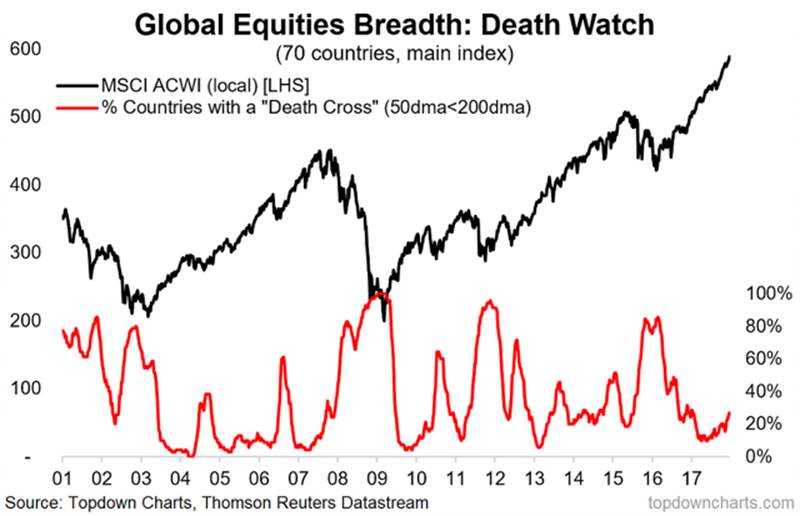
9. Global death-cross watch: a nice & novel chart which tracks the proportion of markets which have a “death cross” (i.e. the 50-day moving average passing below the 200 day) across 70 countries. This is probably the most comprehensive breadth view of global equities and a key early warning chart (i.e. this indicator usually turns up leading into a correction - like it is now).
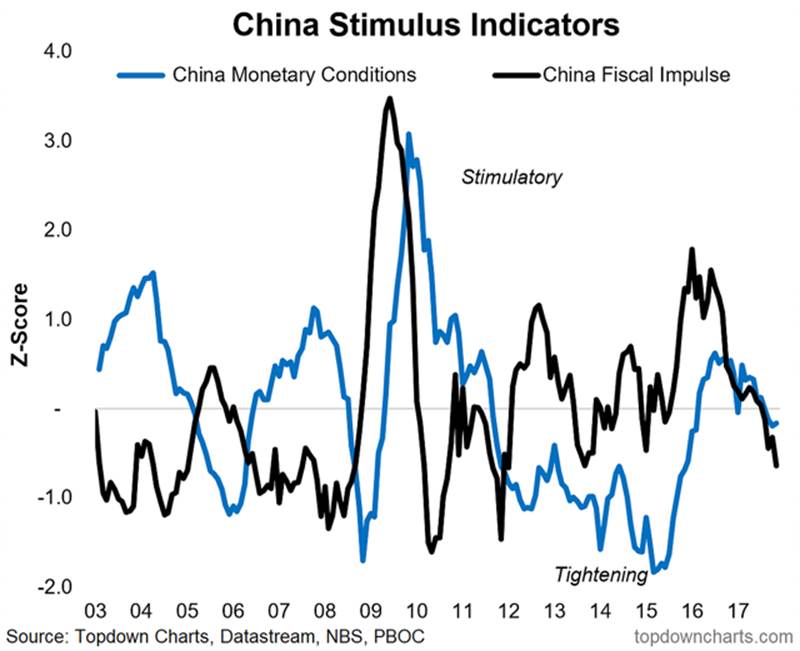
10. Last but certainly not least is China. A number of the big tailwinds (property, exports, stimulus) that helped China avoid a recession in 2015/16 are starting to turn. The fiscal/monetary policy stimulus indicators in this chart helped us pick the upturn in China before most others caught on, and I think this will be a key one to monitor when thinking about the outlook for China in 2018 and beyond.
Tying it all together, the main takeaways are that on a macro front, inflation is set to re-emerge this year and will reinforce the global turning of the monetary policy tides, and underpin a bearish-bonds bias. Across a spectrum of risk pricing metrics, all appears calm (complacent?) at this stage, while the economic indicators for now reinforce this second "great moderation".
Greater incidence of overvaluation across markets and asset classes mean the stakes are progressively higher as the cycle matures. Along with a turning of tailwinds in China, this all means that 2018 will likely be a more challenging year for investors and a possible watershed moment for global markets.
At this stage we remain selectively bullish on global equities (paying attention to relative value), cautiously bullish emerging markets, and bearish commodities (in aggregate) over the medium term. On the defensive side we remain bearish on bonds (particularly global sovereign), in preference of cash to perform the role of capital preservation.
Overall there is pressure to reduce the time horizon and a greater sense of readiness to shift positioning/views should the data and indicators justify it, particularly as short-term risks build. While 2018 will likely be 'harder', it will most likely be a case of great challenges and great opportunities.
Thanks for reading
Sincerely,
Callum Thomas
Head of Research
Topdown Charts
www.topdowncharts.com
Callum is the founder of Topdown Charts – a chart driven independent institutional research house covering global asset allocation and economics. Callum has a background in multi-asset investment strategy on the buyside and has built up strong research and analytical expertise for generating global macro driven investment insights. Callum’s vision in creating Topdown Charts is to serve as a vital resource for portfolio managers on idea generation, risk management, and in informing their macro view. Callum is based in Queenstown, New Zealand.
© 2018 Callum Thomas - All Rights Reserved
Disclaimer: The above is a matter of opinion provided for general information purposes only and is not intended as investment advice. Information and analysis above are derived from sources and utilising methods believed to be reliable, but we cannot accept responsibility for any losses you may incur as a result of this analysis. Individuals should consult with their personal financial advisors.
© 2005-2022 http://www.MarketOracle.co.uk - The Market Oracle is a FREE Daily Financial Markets Analysis & Forecasting online publication.