


Gold: This Might Hurt
Commodities / Gold and Silver 2017 Dec 29, 2017 - 12:32 PM GMTBy: P_Radomski_CFA

 The gold volatility index moved to a new all-time low and there was no meaningful action in gold recently. Well, we profited on the decline and on the following upswing, but the price action that we saw was nothing to call home about. For months, gold has been moving around the $1,300 level and it’s trading relatively close to it also today. But, will this action persist for much longer? Not likely. It seems that something is about to hit the fan.
Before this week, there were many signs pointing to lower prices of precious metals in the following weeks, but not necessarily in the following days. This week, we are finally seeing the bearish short-term confirmations. We discussed them yesterday and in today’s analysis, we provide a big update.
Let’s start with the gold chart (charts courtesy of http://stockcharts.com).
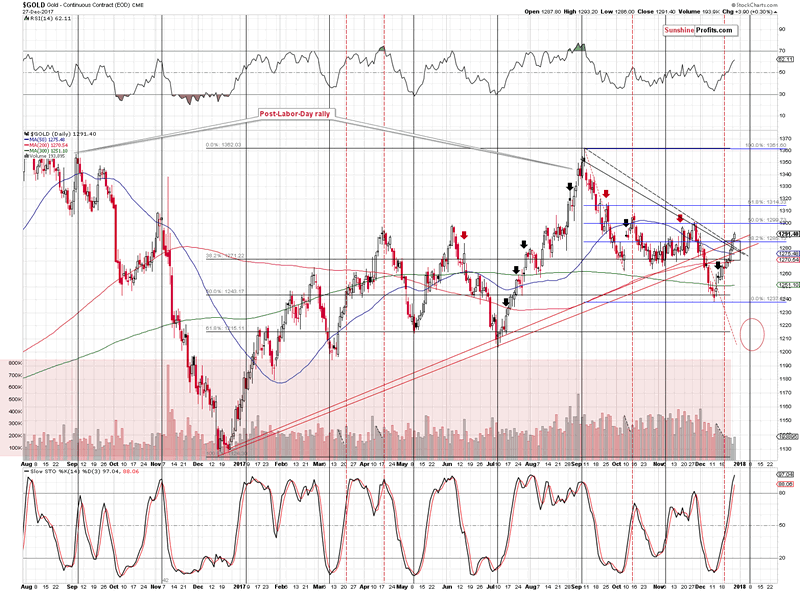
Gold moved above the combination of resistance levels, but it doesn’t seem to be a big deal. The reasons are the proximity of another combination of resistance levels just several dollars higher and the fact that we have multiple other bearish indications in place.
As far as the combination of resistance levels is concerned, we have the 50% Fibonacci retracement, the November and (approximately) October highs and the psychologically important $1,300 level.
In terms of time, we have the apex of the triangle based on the intraday extremes (declining black dashed line and the lower of the rising red lines) pointing to a turning point at the end of the year. We also have gold’s turning point around January 8th. Given silver’s outperformance and miners’ small decline that we saw yesterday, it seems that the former time target is more likely to mark the final top for this corrective upswing. This is particularly the case since we saw a turning point in the first days of 2017 but the bottom actually formed in December.
So, it seems that the end of the year might also mark the end of gold’s rally.
Also, there was no breakout above the rising resistance lines in the case of gold priced in terms of the euro.
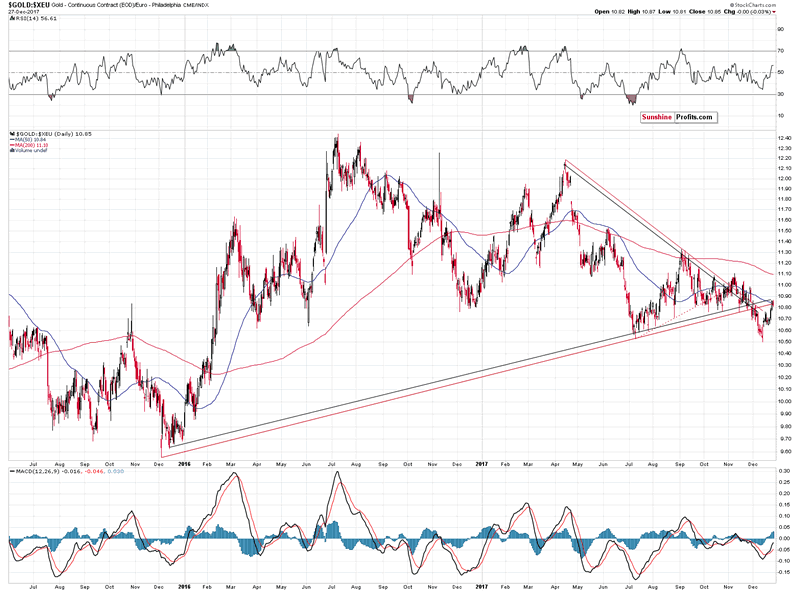
The yellow metal remains below the rising resistance lines, so the implications remain clearly bearish.
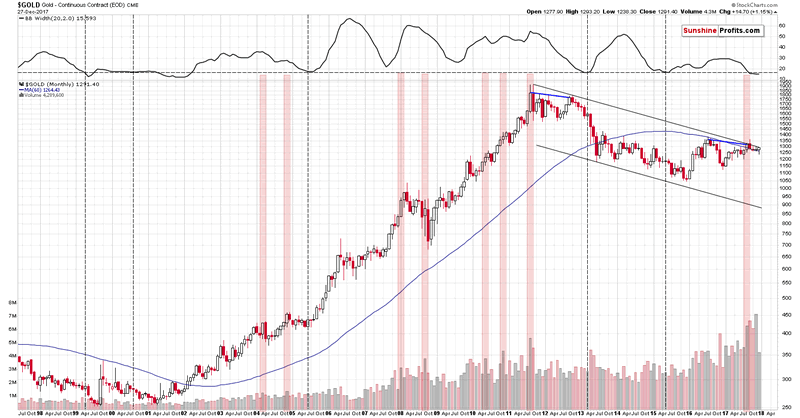
In terms of the monthly price changes, the current situation in gold became even more critical.
In yesterday’s alert, we wrote the following:
We described the analogy multiple times, but the key thing about the analogy is still right in front of us. The long-story-short version is this: the blue lines that connect the two key tops before the slide are analogous and their follow-up action is very similar as well. This makes it likely for the 2013 decline to be repeated either to the letter or on an approximate basis.
There was only one up month during the 2012 – 2013 decline and it was right before the most volatile and powerful part of the slide. This December is an up month so far, so unless gold declines shortly, we will have a very strong bearish indication for the following weeks. There are only three sessions left until the end of the year, so the above seems quite likely.
Combining the above with the timing target based on the apex of the triangle makes things very interesting. Gold is likely to reverse tomorrow, at the end of the year, which means that December is very likely to be an up month for gold. This in turn means that gold is likely to decline very sharply in January.
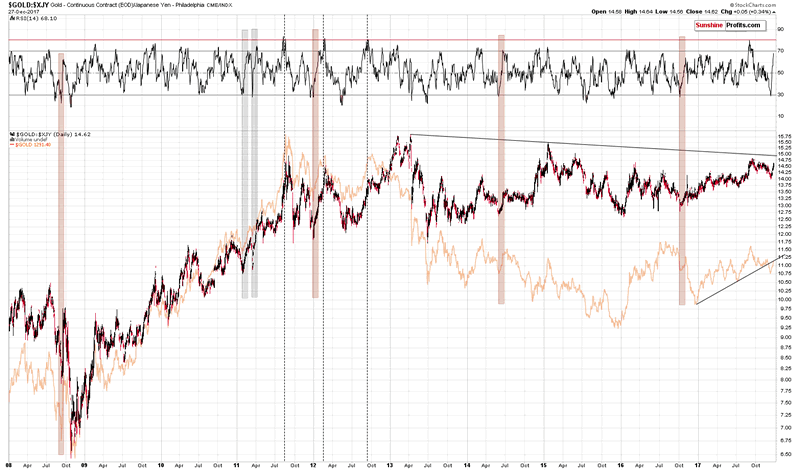
The situation in gold priced in the Japanese yen just became even more extreme. In yesterday’s alert, we described the above chart in the following way:
What we discuss below is what’s generally below the investment surface. It’s the things that people usually don’t write about because they are not aware of these relationships or that they don’t care enough to analyze them thoroughly. We do.
(…)
The next thing that’s rarely monitored is gold’s price in terms of the Japanese yen. Even if it is monitored, then the dynamics of the RSI indicator plotted on it are never or almost never discussed.
Gold very often moves in tune with the Japanese yen. We even received a few messages in the past years saying that analyzing gold is pointless as all it does is track the yen. On a side note, the above chart shows that between 2009 and the 2011 top, gold was much more than that.
Whenever gold doesn’t move in tune with the USD/JPY rate, the price of gold in terms of the Japanese yen changes. It recently changed significantly and the question is: “What can we infer from this kind of movement?”
Indicators are useful in many cases, including for making comparisons between price moves. Without them it would be more difficult to discuss similarities. In the current case, the RSI is after a sudden increase from below 30 to almost 70. There were only several such cases in the past decade. Two cases were seen after a multi-year rally while gold was rising within a relatively steep uptrend. We marked those cases with grey rectangles – they are not very similar to what happened recently. Gold has been trading sideways for a few years an it’s after a breakdown below the medium-term support line.
Consequently, the areas marked with red rectangles are much more similar as they were accompanied by similar developments. In these cases, gold was just finishing its corrective upswing. Sounds familiar? Exactly, that’s exactly what all the other charts are indicating.
The thing that we would like to emphasize today is that the maximum level that the RSI indicator achieved during its sudden rallies was just a bit above the 70 level and based on yesterday’s price action, the RSI moved to 68.10. Naturally, the current case can be the odd one and the RSI could rally further. All is possible in the market, but is it likely? No. What’s likely is that the RSI will stop shortly and the same thing is likely for gold priced in the Japanese yen, which makes the same likely for gold priced in the USD.
The above serves as a perfect confirmation of the scenario in which gold tops at the end of the year.
Finally, before summarizing, let’s take a look at the sign that started the current corrective upswing. The big weekly decline in platinum.
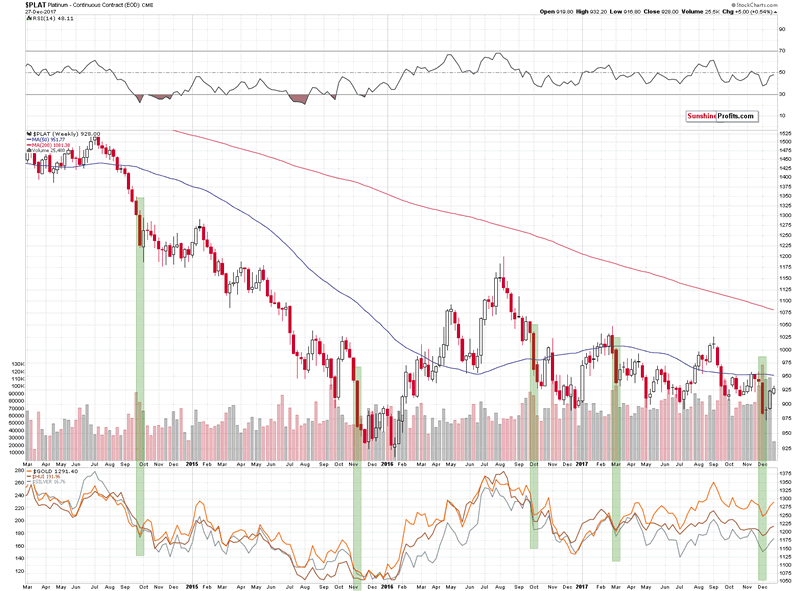
In the December 11 Gold & Silver Trading Alert, we commented on platinum’s slide in the following way:
As odd as it may sound, whenever platinum declined in a very profound way (about 5% in a week), it meant that either a corrective upswing was about to start in the following week (2014, 2016) or that a decline had just ended (2015, March 2017). We’ve seen this phenomenon 4 times in the recent years and in each case, it had bullish implications. 4 out of 4, meaning 100% efficiency is not something that should be ignored.
Does it mean that the precious metals sector will soar immediately? No. The above chart is based on weekly candlesticks in the case of platinum and weekly closing prices in the case of gold, silver and the HUI Index that are visible in the lower part of the above chart. Consequently, whatever implications the above chart has, they are in terms of the next week’s closing prices. So, gold, silver and mining stock are likely to end the next week higher, but not necessarily rally in its first part.
We previously mentioned that the Fed interest rate decision day could mark a turning point or we could see the interim bottom very close to it. The above chart supports this outlook and it suggests that we should be prepared to either exit the short positions or to switch to long ones. We are considering both options and which decision we take will depend on the confirmations that we get in the meantime.
The situation developed in line with the above and the reason that we are bringing this topic back today is to check if the follow-up action that was likely to be seen, was already seen. We discussed the potential size of the rally in the December 14 Alert:
Back in September 2014, gold rallied about $50, in 2016 it soared by about $80 (but about $50 in terms of weekly closing prices) and earlier this year gold moved higher by about $90. The 2015 bottom resulted in much bigger temporary gains.
The difference between the above cases is quite significant. The reason could be that in two cases, the big weekly decline in platinum took place during bigger declines and in two cases it took place either at the end of the big decline or within a bigger rally.
Since there are multiple reasons to believe that the precious metals sector is in a bigger decline, it seems that we should focus on the analogy to the 2014 and 2016 analogies.
As we wrote earlier, in the first case gold rallied about $65 in terms of intraday highs and about $50 in weekly closing prices. In the second case, it rallied by $80 or $50, using analogous measures. What does it tell us? It’s gives a hint that gold is likely to rally $50 - $80 from the bottom and that the lower part of this range is more likely.
The bottom formed around $1,240 which means that gold was likely to move higher to $1,290 - $1,320, with the lower part of this range as something more likely. According to kitco.com, today’s intraday high in gold was $1,292.50 (at least that’s the case at the moment of writing these words). It’s certainly likely that the top in gold is already in or at hand.
Summing up, the medium-term outlook for the precious metals market remains bearish as confirmed by multiple factors, and based on the most recent short-term factors it seems that the corrective upswing in gold, silver and mining stocks is either over or close to being over. Moreover, based on yesterday’s intraday action, yesterday’s closing prices and based on how gold, silver and the USD Index are performing so far today, it seems that the situation is now extremely bearish with the possibility of seeing a big, volatile downswing shortly.
If you enjoyed the above analysis and would like to receive free follow-ups, we encourage you to sign up for our gold newsletter – it’s free and if you don’t like it, you can unsubscribe with just 2 clicks. If you sign up today, you’ll also get 7 days of free access to our premium daily Gold & Silver Trading Alerts. Sign up now.
Thank you.
Przemyslaw Radomski, CFA
Founder, Editor-in-chief
Tools for Effective Gold & Silver Investments - SunshineProfits.com
Tools für Effektives Gold- und Silber-Investment - SunshineProfits.DE
* * * * *
About Sunshine Profits
Sunshine Profits enables anyone to forecast market changes with a level of accuracy that was once only available to closed-door institutions. It provides free trial access to its best investment tools (including lists of best gold stocks and best silver stocks), proprietary gold & silver indicators, buy & sell signals, weekly newsletter, and more. Seeing is believing.
Disclaimer
All essays, research and information found above represent analyses and opinions of Przemyslaw Radomski, CFA and Sunshine Profits' associates only. As such, it may prove wrong and be a subject to change without notice. Opinions and analyses were based on data available to authors of respective essays at the time of writing. Although the information provided above is based on careful research and sources that are believed to be accurate, Przemyslaw Radomski, CFA and his associates do not guarantee the accuracy or thoroughness of the data or information reported. The opinions published above are neither an offer nor a recommendation to purchase or sell any securities. Mr. Radomski is not a Registered Securities Advisor. By reading Przemyslaw Radomski's, CFA reports you fully agree that he will not be held responsible or liable for any decisions you make regarding any information provided in these reports. Investing, trading and speculation in any financial markets may involve high risk of loss. Przemyslaw Radomski, CFA, Sunshine Profits' employees and affiliates as well as members of their families may have a short or long position in any securities, including those mentioned in any of the reports or essays, and may make additional purchases and/or sales of those securities without notice.
Przemyslaw Radomski Archive |
© 2005-2022 http://www.MarketOracle.co.uk - The Market Oracle is a FREE Daily Financial Markets Analysis & Forecasting online publication.